- Review
- Open access
- Published:
Healthcare predictive analytics using machine learning and deep learning techniques: a survey
Journal of Electrical Systems and Information Technology volume 10, Article number: 40 (2023)
Abstract
Healthcare prediction has been a significant factor in saving lives in recent years. In the domain of health care, there is a rapid development of intelligent systems for analyzing complicated data relationships and transforming them into real information for use in the prediction process. Consequently, artificial intelligence is rapidly transforming the healthcare industry, and thus comes the role of systems depending on machine learning and deep learning in the creation of steps that diagnose and predict diseases, whether from clinical data or based on images, that provide tremendous clinical support by simulating human perception and can even diagnose diseases that are difficult to detect by human intelligence. Predictive analytics for healthcare a critical imperative in the healthcare industry. It can significantly affect the accuracy of disease prediction, which may lead to saving patients' lives in the case of accurate and timely prediction; on the contrary, in the case of an incorrect prediction, it may endanger patients' lives. Therefore, diseases must be accurately predicted and estimated. Hence, reliable and efficient methods for healthcare predictive analysis are essential. Therefore, this paper aims to present a comprehensive survey of existing machine learning and deep learning approaches utilized in healthcare prediction and identify the inherent obstacles to applying these approaches in the healthcare domain.
Introduction
Each day, human existence evolves, yet the health of each generation either improves or deteriorates. There are always uncertainties in life. Occasionally encounter many individuals with fatal health problems due to the late detection of diseases. Concerning the adult population, chronic liver disease would affect more than 50 million individuals worldwide. However, if the sickness is diagnosed early, it can be stopped. Disease prediction based on machine learning can be utilized to identify common diseases at an earlier stage. Currently, health is a secondary concern, which has led to numerous problems. Many patients cannot afford to see a doctor, and others are extremely busy and on a tight schedule, yet ignoring recurring symptoms for an extended length of time can have significant health repercussions [1].
Diseases are a global issue; thus, medical specialists and researchers are exerting their utmost efforts to reduce disease-related mortality. In recent years, predictive analytic models has played a pivotal role in the medical profession because of the increasing volume of healthcare data from a wide range of disparate and incompatible data sources. Nonetheless, processing, storing, and analyzing the massive amount of historical data and the constant inflow of streaming data created by healthcare services has become an unprecedented challenge utilizing traditional database storage [2,3,4]. A medical diagnosis is a form of problem-solving and a crucial and significant issue in the real world. Illness diagnosis is the process of translating observational evidence into disease names. The evidence comprises data received from evaluating a patient and substances generated from the patient; illnesses are conceptual medical entities that detect anomalies in the observed evidence [5].
Healthcare is the collective effort of society to ensure, provide, finance, and promote health. In the twentieth century, there was a significant shift toward the ideal of wellness and the prevention of sickness and incapacity. The delivery of healthcare services entails organized public or private efforts to aid persons in regaining health and preventing disease and impairment [6]. Health care can be described as standardized rules that help evaluate actions or situations that affect decision-making [7]. Healthcare is a multi-dimensional system. The basic goal of health care is to diagnose and treat illnesses or disabilities. A healthcare system’s key components are health experts (physicians or nurses), health facilities (clinics and hospitals that provide medications and other diagnostic services), and a funding institution to support the first two [8].
With the introduction of systems based on computers, the digitalization of all medical records and the evaluation of clinical data in healthcare systems have become widespread routine practices. The phrase "electronic health records" was chosen by the Institute of Medicine, a division of the National Academies of Sciences, Engineering, and Medicine, in 2003 to define the records that continued to enhance the healthcare sector for the benefit of both patients and physicians. Electronic Health Records (EHR) are "computerized medical records for patients that include all information in an individual's past, present, or future that occurs in an electronic system used to capture, store, retrieve, and link data primarily to offer healthcare and health-related services," according to Murphy, Hanken, and Waters [8].
Daily, healthcare services produce an enormous amount of data, making it increasingly complicated to analyze and handle it in "conventional ways." Using machine learning and deep learning, this data may be properly analyzed to generate actionable insights. In addition, genomics, medical data, social media data, environmental data, and other data sources can be used to supplement healthcare data. Figure 1 provides a visual picture of these data sources. The four key healthcare applications that can benefit from machine learning are prognosis, diagnosis, therapy, and clinical workflow, as outlined in the following section [9].

Illustration of heterogeneous sources contributing to healthcare data [9]
The long-term investment in developing novel technologies based on machine learning as well as deep learning techniques to improve the health of individuals via the prediction of future events reflects the increased interest in predictive analytics techniques to enhance healthcare. Clinical predictive models, as they have been formerly referred to, assisted in the diagnosis of people with an increased probability of disease. These prediction algorithms are utilized to make clinical treatment decisions and counsel patients based on some patient characteristics [10].
The concept of medical care is used to stress the organization and administration of curative care, which is a subset of health care. The ecology of medical care was first introduced by White in 1961. White also proposed a framework for perceiving patterns of health concerning symptoms experienced by populations of interest, along with individuals’ choices in getting medical treatment. In this framework, it is possible to calculate the proportion of the population that used medical services over a specific period of time. The "ecology of medical care" theory has become widely accepted in academic circles over the past few decades [6].
Medical personnel usually face new problems, changing tasks, and frequent interruptions because of the system's dynamism and scalability. This variability often makes disease recognition a secondary concern for medical experts. Moreover, the clinical interpretation of medical data is a challenging task from an epistemological point of view. This not only applies to professionals with extensive experience but also to representatives, such as young physician assistants, with varied or little experience [11]. The limited time available to medical personnel, the speedy progression of diseases, and the fluctuating patient dynamics make diagnosis a particularly complex process. However, a precise method of diagnosis is critical to ensuring speedy treatment and, thus, patient safety [12].
Predictive analytics for health care are critical industry requirements. It can have a significant impact on the accuracy of disease prediction, which can save patients' lives in the case of an accurate and timely prediction but can also endanger patients' lives in the case of an incorrect prediction. Diseases must therefore be accurately predicted and estimated. As a result, dependable and efficient methods for healthcare predictive analysis are required.
The purpose of this paper is to present a comprehensive review of common machine learning and deep learning techniques that are utilized in healthcare prediction, in addition to identifying the inherent obstacles that are associated with applying these approaches in the healthcare domain.
The rest of the paper is organized as follows: Section "Background" gives a theoretical background on artificial intelligence, machine learning, and deep learning techniques. Section "Disease prediction with analytics" outlines the survey methodology and presents a literature review of machine learning as well as deep learning approaches employed in healthcare prediction. Section "Results and Discussion" gives a discussion of the results of previous works related to healthcare prediction. Section "Challenges" covers the existing challenges related to the topic of this survey. Finally, Section "Conclusion" concludes the paper.
Background
The extensive research and development of cutting-edge tools based on machine learning and deep learning for predicting individual health outcomes demonstrate the increased interest in predictive analytics techniques to improve health care. Clinical predictive models assisted physicians in better identifying and treating patients who were at a higher risk of developing a serious illness. Based on a variety of factors unique to each individual patient, these prediction algorithms are used to advise patients and guide clinical practice.
Artificial intelligence (AI) is the ability of a system to interpret data, and it makes use of computers and machines to improve humans' capacity for decision-making, problem-solving, and technological innovation [13]. Figure 2 depicts machine learning and deep learning as subsets of AI.

AI, ML, and DL
Machine learning
Machine learning (ML) is a subfield of AI that aims to develop predictive algorithms based on the idea that machines should have the capability to access data and learn on their own [14]. ML utilizes algorithms, methods, and processes to detect basic correlations within data and create descriptive and predictive tools that process those correlations. ML is usually associated with data mining, pattern recognition, and deep learning. Although there are no clear boundaries between these areas and they often overlap, it is generally accepted that deep learning is a relatively new subfield of ML that uses extensive computational algorithms and large amounts of data to define complex relationships within data. As shown in Fig. 3, ML algorithms can be divided into three categories: supervised learning, unsupervised learning, and reinforcement learning [15].

Different types of machine learning algorithms
Supervised learning
Supervised learning is an ML model for investigating the input–output correlation information of a system depending on a given set of training examples that are paired between the inputs and the outputs [16]. The model is trained with a labeled dataset. It matches how a student learns fundamental math from a teacher. This kind of learning requires labeled data with predicted correct answers based on algorithm output [17]. The most widely used supervised learning-based techniques include linear regression, logistic regression, decision trees, random forests, support vector machines, K-nearest neighbor, and naive Bayes.
A. Linear regression
Linear regression is a statistical method commonly used in predictive investigations. It succeeds in forecasting the dependent, output, variable (Y) based on the independent, input, variable (X). The connection between X and Y is represented as shown in Eq. 1 assuming continuous, real, and numeric parameters.
where m indicates the slope and c indicates the intercept. According to Eq. 1, the association between the independent parameters (X) and the dependent parameters (Y) can be inferred [18].
The advantage of linear regression is that it is straightforward to learn and easy to-eliminate overfitting through regularization. One drawback of linear regression is that it is not convenient when applied to nonlinear relationships. However, it is not recommended for most practical applications as it greatly simplifies real-world problems [19]. The implementation tools utilized in linear regression are Python, R, MATLAB, and Excel.
As shown in Fig. 4, observations are highlighted in red, and random deviations' result (shown in green) from the basic relationship (shown in yellow) between the independent variable (x) and the dependent variable (y) [20].

Linear regression model
B. Logistic regression
Logistic regression, also known as the logistic model, investigates the correlation between many independent variables and a categorical dependent variable and calculates the probability of an event by fitting the data to a logistic curve [21]. Discrete mean values must be binary, i.e., have only two outcomes: true or false, 0 or 1, yes or no, or either superscript or subscript. In logistic regression, categorical variables need to be predicted and classification problems should be solved. Logistic regression can be implemented using various tools such as R, Python, Java, and MATLAB [18]. Logistic regression has many benefits; for example, it shows the linear relationship between dependent and independent variables with the best results. It is also simple to understand. On the other hand, it can only predict numerical output, is not relevant to nonlinear data, and is sensitive to outliers [22].
C. Decision tree
The decision tree (DT) is the supervised learning technique used for classification. It combines the values of attributes based on their order, either ascending or descending [23]. As a tree-based strategy, DT defines each path starting from the root using a data-separating sequence until a Boolean conclusion is attained at the leaf node [24, 25]. DT is a hierarchical representation of knowledge interactions that contains nodes and links. When relations are employed to classify, nodes reflect purposes [26, 27]. An example of DT is presented in Fig. 5.

Example of a DT
DTs have various drawbacks, such as increased complexity with increasing nomenclature, small modifications that may lead to a different architecture, and more processing time to train data [18]. The implementation tools used in DT are Python (Scikit-Learn), RStudio, Orange, KNIME, and Weka [22].
D. Random forest
Random forest (RF) is a basic technique that produces correct results most of the time. It may be utilized for classification and regression. The program produces an ensemble of DTs and blends them [28].
In the RF classifier, the higher the number of trees in the forest, the more accurate the results. So, the RF has generated a collection of DTs called the forest and combined them to achieve more accurate prediction results. In RF, each DT is built only on a part of the given dataset and trained on approximations. The RF brings together several DTs to reach the optimal decision [18].
As indicated in Fig. 6, RF randomly selects a subset of features from the data, and from each subset it generates n random trees [20]. RF will combine the results from all DTs and provide them in the final output.

Random forest architecture
Two parameters are being used for tuning RF models: mtry—the count of randomly selected features to be considered in each division; and ntree—the model trees count. The mtry parameter has a trade-off: Large values raise the correlation between trees, but enhance the per-tree accuracy [29].
The RF works with a labeled dataset to do predictions and build a model. The final model is utilized to classify unlabeled data. The model integrates the concept of bagging with a random selection of traits to build variance-controlled DTs [30].
RF offers significant benefits. First, it can be utilized for determining the relevance of the variables in a regression and classification task [31, 32]. This relevance is measured on a scale, based on the impurity drop at each node used for data segmentation [33]. Second, it automates missing values contained in the data and resolves the overfitting problem of DT. Finally, RF can efficiently handle huge datasets. On the other side, RF suffers from drawbacks; for example, it needs more computing and resources to generate the output results and it requires training effort due to the multiple DTs involved in it. The implementation tools used in RF are Python Scikit-Learn and R [18].
E. Support vector machine
The supervised ML technique for classification issues and regression models is called the support vector machine (SVM). SVM is a linear model that offers solutions to issues that are both linear and nonlinear. as shown in Fig. 7. Its foundation is the idea of margin calculation. The dataset is divided into several groups to build relations between them [18].

Support vector machine
SVM is a statistics-based learning method that follows the principle of structural risk minimization and aims to locate decision bounds, also known as hyperplanes, that can optimally separate classes by finding a hyperplane in a usable N-dimensional space that explicitly classifies data points [34,35,36]. SVM indicates the decision boundary between two classes by defining the value of each data point, in particular the support vector points placed on the boundary between the respective classes [37].
SVM has several advantages; for example, it works perfectly with both semi-structured and unstructured data. The kernel trick is a strong point of SVM. Moreover, it can handle any complex problem with the right functionality and can also handle high-dimensional data. Furthermore, SVM generalization has less allocation risk. On the other hand, SVM has many downsides. The model training time is increased on a large dataset. Choosing the right kernel function is also a difficult process. In addition, it is not working well with noisy data. Implementation tools used in SVM include SVMlight with C, LibSVM with Python, MATLAB or Ruby, SAS, Kernlab, Scikit-Learn, and Weka [22].
F. K-nearest neighbor
K-nearest neighbor (KNN) is an "instance-based learning" or non-generalized learning algorithm, which is often known as a “lazy learning” algorithm [38]. KNN is used for solving classification problems. To anticipate the target label of the novel test data, KNN determines the distance of the nearest training data class labels with a new test data point in the existence of a K value, as shown in Fig. 8. It then calculates the number of nearest data points using the K value and terminates the label of the new test data class. To determine the number of nearest-distance training data points, KNN usually sets the value of K according to (1): k = n^(1/2), where n is the size of the dataset [22].

K-nearest neighbor
KNN has many benefits; for example, it is sufficiently powerful if the size of the training data is large. It is also simple and flexible, with attributes and distance functions. Moreover, it can handle multi-class datasets. KNN has many drawbacks, such as the difficulty of choosing the appropriate K value, it being very tedious to choose the distance function type for a particular dataset, and the computation cost being a little high due to the distance between all the training data points, the implementation tools used in KNN are Python (Scikit-Learn), WEKA, R, KNIME, and Orange [22].
G. Naive Bayes
Naive Bayes (NB) focuses on the probabilistic model of Bayes' theorem and is simple to set up as the complex recursive parameter estimation is basically none, making it suitable for huge datasets [39]. NB determines the class membership degree based on a given class designation [40]. It scans the data once, and thus, classification is easy [41]. Simply, the NB classifier assumes that there is no relation between the presence of a particular feature in a class and the presence of any other characteristic. It is mainly targeted at the text classification industry [42].
NB has great benefits such as ease of implementation, can provide a good result even using fewer training data, can manage both continuous and discrete data, and is ideal to solve the prediction of multi-class problems, and the irrelevant feature does not affect the prediction. NB, on the other hand, has the following drawbacks: It assumes that all features are independent which is not always viable in real-world problems, suffers from zero frequency problems, and the prediction of NB is not usually accurate. Implementation tools are WEKA, Python, RStudio, and Mahout [22].
To summarize the previously discussed models, Table 1 demonstrates the advantages and disadvantages of each model.
Unsupervised learning
Unlike supervised learning, there are no correct answers and no teachers in unsupervised learning [42]. It follows the concept that a machine can learn to understand complex processes and patterns on its own without external guidance. This approach is particularly useful in cases where experts have no knowledge of what to look for in the data and the data itself do not include the objectives. The machine predicts the outcome based on past experiences and learns to predict the real-valued outcome from the information previously provided, as shown in Fig. 9.
Workflow of unsupervised learning [23]
Unsupervised learning is widely used in the processing of multimedia content, as clustering and partitioning of data in the lack of class labels is often a requirement [43]. Some of the most popular unsupervised learning-based approaches are k-means, principal component analysis (PCA), and apriori algorithm.
A. k-means
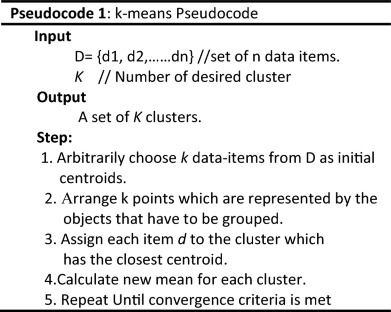
The k-means algorithm is the common portioning method [44] and one of the most popular unsupervised learning algorithms that deal with the well-known clustering problem. The procedure classifies a particular dataset by a certain number of preselected (assuming k-sets) clusters [45]. The pseudocode of the K-means algorithm is shown in Pseudocode 1.
K means has several benefits such as being more computationally efficient than hierarchical grouping in case of large variables. It provides more compact clusters than hierarchical ones when a small k is used. Also, the ease of implementation and comprehension of assembly results is another benefit. However, K-means have disadvantages such as the difficulty of predicting the value of K. Also, as different starting sections lead to various final combinations, the performance is affected. It is accurate for raw points and local optimization, and there is no single solution for a given K value—so the average of the K value must be run multiple times (20–100 times) and then pick the results with the minimum J [19].
B. Principal component analysis
In modern data analysis, principal component analysis (PCA) is an essential tool as it provides a guide for extracting the most important information from a dataset, compressing the data size by keeping only those important features without losing much information, and simplifying the description of a dataset [46, 47].
PCA is frequently used to reduce data dimensions before applying classification models. Moreover, unsupervised methods, such as dimensionality reduction or clustering algorithms, are commonly used for data visualizations, detection of common trends or behaviors, and decreasing the data quantity to name a few only [48].
PCA converts the 2D data into 1D data. This is done by changing the set of variables into new variables known as principal components (PC) which are orthogonal [23]. In PCA, data dimensions are reduced to make calculations faster and easier. To illustrate how PCA works, let us consider an example of 2D data. When these data are plotted on a graph, it will take two axes. Applying PCA, the data turn into 1D. This process is illustrated in Fig. 10 [49].

Visualization of data before and after applying PCA [49]
C. Apriori
Apriori algorithm is considered an important algorithm, which was first introduced by R. Agrawal and R. Srikant, and published in [50, 51].
The principle of the apriori algorithm is to represent the filter generation strategy. It creates a filter element set (k + 1) based on the repeated k element groups. Apriori uses an iterative strategy called planar search, where k item sets are employed to explore (k + 1) item sets. First, the set of repeating 1 item is produced by scanning the dataset to collect the number for each item and then collecting items that meet the minimum support. The resulting group is called L1. Then L1 is used to find L2, the recursive set of two elements is used to find L3, and so on until no repeated k element groups are found. Finding every Lk needs a full dataset scan. To improve production efficiency at the level-wise of repeated element groups, a key property called the apriori property is used to reduce the search space. Apriori property states that all non-empty subsets of a recursive element group must be iterative. A two-step technique is used to identify groups of common elements: join and prune activities [52].
Although it is simple, the apriori algorithm suffers from several drawbacks. The main limitation is the costly wasted time to contain many candidates sets with a lot of redundant item sets. It also suffers from low minimum support or large item sets, and multiple rounds of data are needed for data mining which usually results in irrelevant items, in addition to difficulties in discovering individual elements of events [53, 54].
To summarize the previously discussed models, Table 2 demonstrates the advantages and disadvantages of each model.
Reinforcement learning
Reinforcement learning (RL) is different from supervised learning and unsupervised learning. It is a goal-oriented learning approach. RL is closely related to an agent (controller) that takes responsibility for the learning process to achieve a goal. The agent chooses actions, and as a result, the environment changes its state and returns rewards. Positive or negative numerical values are used as rewards. An agent's goal is to maximize the rewards accumulated over time. A job is a complete environment specification that identifies how to generate rewards [55]. Some of the most popular reinforcement learning-based algorithms are the Q-learning algorithm and the Monte Carlo tree search (MCTS).
A. Q-learning
Q-learning is a type of model-free RL. It can be considered an asynchronous dynamic programming approach. It enables agents to learn how to operate optimally in Markovian domains by exploring the effects of actions, without the need to generate domain maps [56]. It represented an incremental method of dynamic programming that imposed low computing requirements. It works through the successive improvement of the assessment of individual activity quality in particular states [57].
In information theory, Q-learning is strongly employed, and other related investigations are underway. Recently, Q-learning combined with information theory has been employed in different disciplines such as natural language processing (NLP), pattern recognition, anomaly detection, and image classification [58,59,60,60]. Moreover, a framework has been created to provide a satisfying response based on the user’s utterance using RL in a voice interaction system [61]. Furthermore, a high-resolution deep learning-based prediction system for local rainfall has been constructed [62].
The advantage of developmental Q-learning is that it is possible to identify the reward value effectively on a given multi-agent environment method as agents in ant Q-learning are interacting with each other. The problem with Q-learning is that its output can be stuck in the local minimum as agents just take the shortest path [63].
B. Monte Carlo tree search
Monte Carlo tree search (MCTS) is an effective technique for solving sequential selection problems. Its strategy is based on a smart tree search that balances exploration and exploitation. MCTS presents random samples in the form of simulations and keeps activity statistics for better educated choices in each future iteration. MCTS is a decision-making algorithm that is employed in searching tree-like huge complex regions. In such trees, each node refers to a state, which is also referred to as problem configuration, while edges represent transitions from one state to another [64].
The MCTS is related directly to cases that can be represented by a Markov decision process (MDP), which is a type of discrete-time random control process. Some modifications of the MCTS make it possible to apply it to partially observable Markov decision processes (POMDP) [65]. Recently, MCTS coupled with deep RL became the base of AlphaGo developed by Google DeepMind and documented in [66]. The basic MCTS method is conceptually simple, as shown in Fig. 11.

Basic MCTS process
Tree 1 is constructed progressively and unevenly. The tree policy is utilized to get the critical node of the current tree for each iteration of the method. The tree strategy seeks to strike a balance between exploration and exploitation concerns. Then, from the specified node, simulation 2 is run, and the search tree is then updated according to the obtained results. This comprises adding a child node that matches the specified node's activity and updating its ancestor's statistics. During this simulation, movements are performed based on some default policy, which in its simplest case is to make uniform random movements. The benefit of MCTS is that there is no need to evaluate the values of the intermediate state, which significantly minimizes the amount of required knowledge in the field [67].
To summarize the previously discussed models, Table 3 demonstrates the advantages and disadvantages of each model.
Deep learning
Over the past decades, ML has had a significant impact on our daily lives with examples including efficient computer vision, web search, and recognition of optical characters. In addition, by applying ML approaches, AI at the human level has also been improved [68,69,70]. However, when it comes to the mechanisms of human information processing (such as sound and vision), the performance of traditional ML algorithms is far from satisfactory. The idea of deep learning (DL) was formed in the late 20th inspired by the deep hierarchical structures of human voice recognition and production systems. DL breaks have been introduced in 2006 when Hinton built a deep-structured learning architecture called deep belief network (DBN) [71].
The performance of classifiers using DL has been extensively improved with the increased complexity of data compared to classical learning methods. Figure 12 shows the performance of classic ML algorithms and DL methods [72]. The performance of typical ML algorithms becomes stable when they reach the training data threshold, but DL improves its performance as the complexity of data increases [73].

Performance of deep learning concerning the complexity of data
DL (deep ML, or deep-structured learning) is a subset of ML that involves a collection of algorithms attempting to represent high-level abstractions for data through a model that has complicated structures or is otherwise, composed of numerous nonlinear transformations. The most important characteristic of DL is the depth of the network. Another essential aspect of DL is the ability to replace handcrafted features generated by efficient algorithms for unsupervised or semi-supervised feature learning and hierarchical feature extraction [74].
DL has significantly advanced the latest technologies in a variety of applications, including machine translation, speech, and visual object recognition, NLP, and text automation, using multilayer artificial neural networks (ANNs) [15].
Different DL designs in the past two decades give enormous potential for employment in various sectors such as automatic voice recognition, computer vision, NLP, and bioinformatics. This section discusses the most common architectures of DL such as convolutional neural networks (CNNs), long short-term memory (LSTM), and recurrent convolution neural networks (RCNNs) [75].
A. Convolutional neural network
CNNs are special types of neural networks inspired by the human visual cortex and used in computer vision. It is an automatic feed-forward neural network in which information transfers exclusively in the forward direction [76]. CNN is frequently applied in face recognition, human organ localization, text analysis, and biological image recognition [77].
Since CNN was first created in 1989, it has done well in disease diagnosis over the past three decades [78]. Figure 13 depicts the general architecture of a CNN composed of feature extractors and a classifier. Each layer of the network accepts the output of the previous layer as input and passes it on to the next layer in feature extraction layers. A typical CNN architecture consists of three types of layers: convolution, pooling, and classification. There are two types of layers at the network's low and middle levels: convolutional layers and pooling layers. Even-numbered layers are used for convolutions, while odd-numbered layers are used for pooling operations. The convolution and pooling layers' output nodes are categorized in a two-dimensional plane called feature mapping. Each layer level is typically generated by combining one or more previous layers [79].

Architecture of CNN [79]
CNN has a lot of benefits, including a human optical processing system, greatly improved 2D and 3D image processing structure, and is effective in learning and extracting abstract information from 2D information. The max-pooling layer in CNN is efficient in absorbing shape anisotropy. Furthermore, they are constructed from sparse connections with paired weights and contain far fewer parameters than a fully connected network of equal size. CNNs are trained using a gradient-based learning algorithm and are less susceptible to the diminishing gradient problem because the gradient-based approach trains the entire network to directly reduce the error criterion, allowing CNNs to provide highly optimized weights [79].
B. Long short-term memory
LSTM is a special type of recurrent neural network (RNN) with internal memory and multiplicative gates. Since the original LSTM introduction in 1997 by Sepp Hochrieiter and Jürgen Schmidhuber, a variety of LSTM cell configurations have been described [80].
LSTM has contributed to the development of well-known software such as Alexa, Siri, Cortana, Google Translate, and Google voice assistant [81]. LSTM is an implementation of RNN with a special connection between nodes. The special components within the LSTM unit include the input, output, and forget gates. Figure 14 depicts a single LSTM cell.

LSTM unit [82]
where
xt = Input vector at the time t.
ht-1 = Previous hidden state.
ct-1 = Previous memory state.
ht = Current hidden state.
ct = Current memory state.
[x] = Multiplication operation.
[+] = Addition operation.
LSTM is an RNN module that handles gradient loss problems. In general, RNN uses LSTM to eliminate propagation errors. This allows the RNN to learn over multiple time steps. LSTM is characterized by cells that hold information outside the recurring network. This cell enables the RNN to learn over many time steps. The basic principle of LSTMs is the state of the cell, which contains information outside the recurrent network. A cell is like a memory in a computer, which decides when data should be stored, written, read, or erased via the LSTM gateway [82]. Many network architectures use LSTM such as bidirectional LSTM, hierarchical and attention-based LSTM, convolutional LSTM, autoencoder LSTM, grid LSTM, cross-modal, and associative LSTM [83].
Bidirectional LSTM networks move the state vector forward and backward in both directions. This implies that dependencies must be considered in both temporal directions. As a result of inverse state propagation, the expected future correlations can be included in the network's current output [84]. Bidirectional LSTM investigates and analyzes this because it encapsulates spatially and temporally scattered information and can tolerate incomplete inputs via a flexible cell state vector propagation communication mechanism. Based on the detected gaps in data, this filtering mechanism reidentifies the connections between cells for each data sequence. Figure 15 depicts the architecture. A bidirectional network is used in this study to process properties from multiple dimensions into a parallel and integrated architecture [83].

(left) Bidirectional LSTM and (right) filter mechanism for processing incomplete data [84]
Hierarchical LSTM networks solve multi-dimensional problems by breaking them down into subproblems and organizing them in a hierarchical structure. This has the advantage of focusing on a single or multiple subproblems. This is accomplished by adjusting the weights within the network to generate a certain level of interest [83]. A weighting-based attention mechanism that analyzes and filters input sequences is also used in hierarchical LSTM networks for long-term dependency prediction [85].
Convolutional LSTM reduces and filters input data collected over a longer period using convolutional operations applied in LSTM networks or the LSTM cell architecture directly. Furthermore, due to their distinct characteristics, convolutional LSTM networks are useful for modeling many quantities such as spatially and temporally distributed relationships. However, many quantities can be expected collectively in terms of reduced feature representation. Decoding or decoherence layers are required to predict different output quantities not as features but based on their parent units [83].
The LSTM autoencoder solves the problem of predicting high-dimensional parameters by shrinking and expanding the network [86]. The autoencoder architecture is separately trained with the aim of accurate reconstruction of the input data as reported in [87]. Only the encoder is used during testing and commissioning to extract the low-dimensional properties that are transmitted to the LSTM. The LSTM was extended to multimodal prediction using this strategy. To compress the input data and cell states, the encoder and decoder are directly integrated into the LSTM cell architecture. This combined reduction improves the flow of information in the cell and results in an improved cell state update mechanism for both short-term and long-term dependency [83].
Grid long short-term memory is a network of LSTM cells organized into a multi-dimensional grid that can be applied to sequences, vectors, or higher-dimensional data like images [88]. Grid LSTM has connections to the spatial or temporal dimensions of input sequences. Thus, connections of different dimensions within cells extend the normal flow of information. As a result, grid LSTM is appropriate for the parallel prediction of several output quantities that may be independent, linear, or nonlinear. The network's dimensions and structure are influenced by the nature of the input data and the goal of the prediction [89].
A novel method for the collaborative prediction of numerous quantities is the cross-modal and associative LSTM. It uses several standard LSTMs to separately model different quantities. To calculate the dependencies of the quantities, these LSTM streams communicate with one another via recursive connections. The chosen layers' outputs are added as new inputs to the layers before and after them in other streams. Consequently, a multimodal forecast can be made. The benefit of this approach is that the correlation vectors that are produced have the same dimensions as the input vectors. As a result, neither the parameter space nor the computation time increases [90].
C. Recurrent convolution neural network
CNN is a key method for handling various computer vision challenges. In recent years, a new generation of CNNs has been developed, the recurrent convolution neural network (RCNN), which is inspired by large-scale recurrent connections in the visual systems of animals. The recurrent convolutional layer (RCL) is the main feature of RCNN, which integrates repetitive connections among neurons in the normal convolutional layer. With the increase in the number of repetitive computations, the receptive domains (RFs) of neurons in the RCL expand infinitely, which is contrary to biological facts [91].
The RCNN prototype was proposed by Ming Liang and Xiaolin Hu [92, 93], and the structure is illustrated in Fig. 16, in which both forward and redundant connections have local connectivity and weights shared between distinct sites. This design is quite like the recurrent multilayer perceptron (RMLP) concept which is often used for dynamic control [94, 95] (Fig. 17, middle). Like the distinction between MLP and CNN, the primary distinction is that in RMLP, common local connections are used in place of full connections. For this reason, the proposed model is known as RCNN [96].
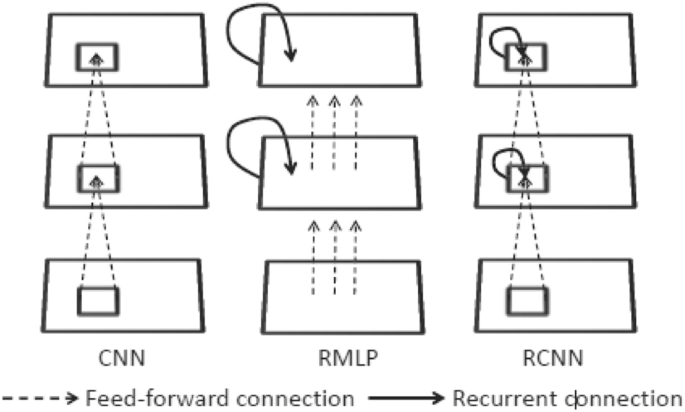
Illustration of the architectures of CNN, RMLP, and RCNN [85]

Illustration of the total number of reviewed papers
The main unit of RCNN is the RCL. RCLs develop through discrete time steps. RCNN offers three basic advantages. First, it allows each unit to accommodate background information in an arbitrarily wide area in the current layer. Second, recursive connections improve the depth of the network while keeping the number of mutable parameters constant through weight sharing. This is consistent with the trend of modern CNN architecture to grow deeper with a relatively limited number of parameters. The third aspect of RCNN is the time exposed in RCNN which is a CNN with many paths between the input layer and the output layer, which makes learning simple. On one hand, having longer paths makes it possible for the model to learn very complex features. On the other hand, having shorter paths may improve the inverse gradient during training [91].
To summarize the previously discussed models, Table 4 demonstrates the advantages and disadvantages of each model.
Disease prediction with analytics
The studies discussed in this paper have been presented and published in high-quality journals and international conferences published by IEEE, Springer, and Elsevier, and other major scientific publishers such as Hindawi, Frontiers, Taylor, and MDPI. The search engines used are Google Scholar, Scopus, and Science Direct. All papers selected covered the period from 2019 to 2022. Machine learning, deep learning, health care, surgery, cardiology, radiology, hepatology, and nephrology are some of the terms used to search for these studies. The studies chosen for this survey are concerned with the use of machine learning as well as deep learning algorithms in healthcare prediction. For this survey, empirical and review articles on the topics were considered. This section discusses existing research efforts that healthcare prediction using various techniques in ML and DL. This survey gives a detailed discussion about the methods and algorithms which are used for predictions, performance metrics, and tools of their model.
ML-based healthcare prediction
To predict diabetes patients, the authors of [97] utilized a framework to develop and evaluate ML classification models like logistic regression, KNN, SVM, and RF. ML method was implemented on the Pima Indian Diabetes Database (PIDD) which has 768 rows and 9 columns. The forecast accuracy delivers 83%. Results of the implementation approach indicate how the logistic regression outperformed other algorithms of ML, in addition only a structured dataset was selected but unstructured data are not considered, also model should be implemented in other healthcare domains like heart disease, and COVID-19, finally other factors should be considered for diabetes prediction, like family history of diabetes, smoking habits, and physical inactivity.
The authors created a diagnosis system in [98] that uses two different datasets (Frankfurt Hospital in Germany and PIDD provided by the UCI ML repository) and four prediction models (RF, SVM, NB, and DT) to predict diabetes. the SVM algorithm performed with an accuracy of 83.1 percent. There are some aspects of this study that need to be improved; such as, using a DL approach to predict diabetes may lead to achieving better results; furthermore, the model should be tested in other healthcare domains such as heart disease and COVID-19 prediction datasets.
In [99], the authors proposed three ML methods (logistic regression, DT, and boosted RF) to assess COVID-19 using OpenData Resources from Mexico and Brazil. To predict rescue and death, the proposed model incorporates just the COVID-19 patient's geographical, social, and economic conditions, as well as clinical risk factors, medical reports, and demographic data. On the dataset utilized, the model for Mexico has a 93 percent accuracy, and an F1 score is 0.79. On the other hand, on the used dataset, the Brazil model has a 69 percent accuracy and an F1 score is 0.75. The three ML algorithms have been examined and the acquired results showed that logistic regression is the best way of processing data. The authors should be concerned about the usage of authentication and privacy management of the created data.
A new model for predicting type 2 diabetes using a network approach and ML techniques was presented by the authors in [100] (logistic regression, SVM, NB, KNN, decision tree, RF, XGBoost, and ANN). To predict the risk of type 2 diabetes, the healthcare data of 1,028 type 2 diabetes patients and 1,028 non-type 2 diabetes patients were extracted from de-identified data. The experimental findings reveal the models’ effectiveness with an area under curve (AUC) varied from 0.79 to 0.91. The RF model achieved higher accuracy than others. This study relies only on the dataset providing hospital admission and discharge summaries from one insurance company. External hospital visits and information from other insurance companies are missing for people with many insurance providers.
The authors of [101] proposed a healthcare management system that can be used by patients to schedule appointments with doctors and verify prescriptions. It gives support for ML to detect ailments and determine medicines. ML models including DT, RF, logistic regression, and NB classifiers are applied to the datasets of diabetes, heart disease, chronic kidney disease, and liver. The results showed that among all the other models, logistic regression had the highest accuracy of 98.5 percent in the heart dataset. while the least accuracy is of the DT classifier which came out to be 92 percent. In the liver dataset the logistic regression with maximum accuracy of 75.17% among all others. In the chronic renal disease dataset, the logistic regression, RF, and Gaussian NB, all performed well with an accuracy of 1, the accuracy of 100% should be verified by using k-fold cross-validation to test the reliability of the models. In the diabetes dataset random forest with maximum accuracy of 83.67 percent. The authors should include a hospital directory as then various hospitals and clinics can be accessed through a single portal. Additionally, image datasets could be included to allow image processing of reports and the deployment of DL to detect diseases.
In [102], the authors developed an ML model to predict the occurrence of Type 2 Diabetes in the following year (Y + 1) using factors in the present year (Y). Between 2013 and 2018, the dataset was obtained as an electronic health record from a private medical institute. The authors applied logistic regression, RF, SVM, XGBoost, and ensemble ML algorithms to predict the outcome of non-diabetic, prediabetes, and diabetes. Feature selection was applied to choose the three classes efficiently. FPG, HbA1c, triglycerides, BMI, gamma-GTP, gender, age, uric acid, smoking, drinking, physical activity, and family history were among the features selected. According to the experimental results, the maximum accuracy was 73% from RF, while the lowest was 71% from the logistic regression model. The authors presented a model that used only one dataset. As a result, additional data sources should be applied to verify the models developed in this study.
The authors of [103] classified the diabetes dataset using SVM and NB algorithms with feature selection to improve the model's accuracy. PIDD is taken from the UCI Repository for analysis. For training and testing purposes the authors employed the k-fold cross-validation model, the SVM classifier was performing better than the NB method it offers around 91% correct predictions; however, the authors acknowledge that they need to extend to the latest dataset that will contain additional attributes and rows.
K-means clustering is an unsupervised ML algorithm that was introduced by the authors of [104] for the purpose of detecting heart disease in its earliest stages using the UCI heart disease dataset. PCA is used for dimensionality reduction. The outcome of the method demonstrates early cardiac disease prediction with 94.06% accuracy. The authors should apply the proposed technique using more than one algorithm and use more than one dataset.
In [105], the authors constructed a predictive model for the classification of diabetes data using the logistic regression classification technique. The dataset includes 459 patients for training data and 128 cases for testing data. The prediction accuracy using logistic regression was obtained at 92%. The main limitation of this research is that the authors have not compared the model with other diabetes prediction algorithms, so it cannot be confirmed.
The authors of [106] developed a prediction model that analyzes the user's symptoms and predicts the disease using ML algorithms (DT classifier, RF classifier, and NB classifier). The purpose of this study was to solve health-related problems by allowing medical professionals to predict diseases at an early stage. The dataset is a sample of 4920 patient records with 41 illnesses diagnosed. A total of 41 disorders were included as a dependent variable. All algorithms achieved the same accuracy score of 95.12%. The authors noticed that overfitting occurred when all 132 symptoms from the original dataset were assessed instead of 95 symptoms. That is, the tree appears to remember the dataset provided and thus fails to classify new data. As a result, just 95 symptoms were assessed during the data-cleansing process, with the best ones being chosen.
In [107], the authors built a decision-making system that assists practitioners to anticipate cardiac problems in exact classification through a simpler method and will deliver automated predictions about the condition of the patient’s heart. implemented 4 algorithms (KNN, RF, DT, and NB), all these algorithms were used in the Cleveland Heart Disease dataset. The accuracy varies for different classification methods. The maximum accuracy is given when they utilized the KNN algorithm with the Correlation factor which is almost 94 percent. The authors should extend the presented technique to leverage more than one dataset and forecast different diseases.
The authors of [108] used the Cleveland dataset, which included 303 cases and 76 attributes, to test out three different classification strategies: NB, SVM, and DT in addition to KNN. Only 14 of these 76 characteristics are going to be put through the testing process. The authors performed data preprocessing to remove noisy data. The KNN obtained the greatest accuracy with 90.79 percent. The authors need to use more sophisticated models to improve the accuracy of early heart disease prediction.
The authors of [109] proposed a model to predict heart disease by making use of a cardiovascular dataset, which was then classified through the application of supervised machine learning algorithms (DT, NB, logistic regression, RF, SVM, and KNN). The results reveal that the DT classification model predicted cardiovascular disorders better than other algorithms with an accuracy of 73 percent. The authors highlighted that the ensemble ML techniques employing the CVD dataset can generate a better illness prediction model.
In [110], the authors attempted to increase the accuracy of heart disease prediction by applying a logistic regression using a healthcare dataset to determine whether patients have heart illness problems or not. The dataset was acquired from an ongoing cardiovascular study on people of the town of Framingham, Massachusetts. The model reached an accuracy prediction of 87 percent. The authors acknowledge the model could be improved with more data and the use of more ML models.
Because breast cancer affects one in every 28 women in India, the author of [111] presented an accurate classification technique to examine the breast cancer dataset containing 569 rows and 32 columns. Similarly employing a heart disease dataset and Lung cancer dataset, this research offered A novel way to function selection. This method of selection is based on genetic algorithms mixed with the SVM classification. The classifier results are Lung cancer 81.8182, Diabetes 78.9272. noticed that the size, kind, and source of data used are not indicated.
In [112], the authors predicted the risk factors that cause heart disease using the K-means clustering algorithm and analyzed with a visualization tool using a Cleveland heart disease dataset with 76 features of 303 patients, holds 209 records with 8 attributes such as age, chest pain type, blood pressure, blood glucose level, ECG in rest, heart rate as well as four types of chest pain. The authors forecast cardiac diseases by taking into consideration the primary characteristics of four types of chest discomfort solely and K-means clustering is a common unsupervised ML technique.
The aim of the article [113] was to report the advantages of using a variety of data mining (DM) methods and validated heart disease survival prediction models. From the observations, the authors proposed that logistic regression and NB achieved the highest accuracy when performed on a high-dimensional dataset on the Cleveland hospital dataset and DT and RF produce better results on low-dimensional datasets. RF delivers more accuracy than the DT classifier as the algorithm is an optimized learning algorithm. The author mentioned that this work can be extended to other ML algorithms, the model could be developed in a distributed environment such as Map–Reduce, Apache Mahout, and HBase.
In [114], the authors proposed a single algorithm named hybridization to predict heart disease that combines used techniques into one single algorithm. The presented method has three phases. Preprocessing phase, classification phase, and diagnosis phase. They employed the Cleveland database and algorithms NB, SVM, KNN, NN, J4.8, RF, and GA. NB and SVM always perform better than others, whereas others depend on the specified features. results attained an accuracy of 89.2 percent. The authors need to is the key goal. Notice that the dataset is little; hence, the system was not able to train adequately, so the accuracy of the method was bad.
Using six algorithms (logistic regression, KNN, DT, SVM, NB, and RF), the authors of [115] explored different data representations to better understand how to use clinical data for predicting liver disease. The original dataset was taken from the northeast of Andhra Pradesh, India. includes 583 liver patient data, whereas 75.64 percent are male, and 24.36 percent are female. The analysis result indicated that the logistic regression classifier delivers the most increased order exactness of 75 percent depending on the f1 measure to forecast the liver illness and NB gives the least precision of 53 percent. The authors merely studied a few prominent supervised ML algorithms; more algorithms can be picked to create an increasingly exact model of liver disease prediction and performance can be steadily improved.
In [116], the authors aimed to predict coronary heart disease (CHD) based on historical medical data using ML technology. The goal of this study is to use three supervised learning approaches, NB, SVM, and DT, to find correlations in CHD data that could aid improve prediction rates. The dataset contains a retrospective sample of males from KEEL, a high-risk heart disease location in the Western Cape of South Africa. The model utilized NB, SVM, and DT. NB achieved the most accurate among the three models. SVM and DT J48 outperformed NB with a specificity rate of 82 percent but showed an inadequate sensitivity rate of less than 50 percent.
With the help of DM and network analysis methods, the authors of [117] created a chronic disease risk prediction framework that was created and evaluated in the Australian healthcare system to predict type 2 diabetes risk. Using a private healthcare funds dataset from Australia that spans six years and three different predictive algorithms (regression, parameter optimization, and DT). The accuracy of the prediction ranges from 82 to 87 percent. The hospital admission and discharge summary are the dataset's source. As a result, it does not provide information about general physician visits or future diagnoses.
DL-based healthcare prediction
With the help of DL algorithms such as CNN for autofeature extraction and illness prediction, the authors of [118] proposed a system for predicting patients with the more common inveterate diseases, and they used KNN for distance calculation to locate the exact matching in the dataset and the outcome of the final sickness prediction. A combination of disease symptoms was made for the structure of the dataset, the living habits of a person, and the specific attaches to doctor consultations which are acceptable in this general disease prediction. In this study, the Indian chronic kidney disease dataset was utilized that comprises 400 occurrences, 24 characteristics, and 2 classes were restored from the UCI ML store. Finally, a comparative study of the proposed system with other algorithms such as NB, DT, and logistic regression has been demonstrated in this study. The findings showed that the proposed system gives an accuracy of 95% which is higher than the other two methods. So, the proposed technique should be applied using more than one dataset.
In [119], the authors developed a DL approach that uses chest radiography images to differentiate between patients with mild, pneumonia, and COVID-19 infections, providing a valid mechanism for COVID-19 diagnosis. To increase the intensity of the chest X-ray image and eliminate noise, image-enhancing techniques were used in the proposed system. Two distinct DL approaches based on a pertained neural network model (ResNet-50) for COVID-19 identification utilizing chest X-ray (CXR) pictures are proposed in this work to minimize overfitting and increase the overall capabilities of the suggested DL systems. The authors emphasized that tests using a vast and hard dataset encompassing several COVID-19 cases are necessary to establish the efficacy of the suggested system.
Diabetes disease prediction was the topic of the article [120], in which the authors presented a cuckoo search-based deep LSTM classifier for prediction. The deep convLSTM classifier is used in cuckoo search optimization, which is a nature-inspired method for accurately predicting disease by transferring information and therefore reducing time consumption. The PIMA dataset is used to predict the onset of diabetes. The National Institute of Diabetes and Digestive and Kidney Diseases provided the data. The dataset is made up of independent variables including insulin level, age, and BMI index, as well as one dependent variable. The new technique was compared to traditional methods, and the results showed that the proposed method achieved 97.591 percent accuracy, 95.874 percent sensitivity, and 97.094 percent specificity, respectively. The authors noticed more datasets are needed, as well as new approaches to improve the classifier's effectiveness.
In [121], the authors presented a wavelet-based convolutional neural network to handle data limitations in this time of COVID-19 fast emergence. By investigating the influence of discrete wavelet transform decomposition up to 4 levels, the model demonstrated the capability of multi-resolution analysis for detecting COVID-19 chest X-rays. The wavelet sub-bands are CNN’s inputs at each decomposition level. COVID-19 chest X-ray-12 is a collection of 1,944 chest X-ray pictures divided into 12 groups that were compiled from two open-source datasets (National Institute Health containing several X-rays of pneumonia-related diseases, whereas the COVID-19 dataset is collected from Radiology Society North America). COVID-Neuro wavelet, a suggested model, was trained alongside other well-known ImageNet pre-trained models on COVID-CXR-12. The authors acknowledge they hope to investigate the effects of other wavelet functions besides the Haar wavelet.
A CNN framework for COVID-19 identification was suggested in [122] it made use of computed tomography images that was developed by the authors. The proposed framework employs a public CT dataset of 2482 CT images from patients of both classifications. the system attained an accuracy of 96.16 percent and recall of 95.41 percent after training using only 20 percent of the dataset. The authors stated that the use of the framework should be extended to multimodal medical pictures in the future.
Using an LSTM network enhanced by two processes to perform multi-label classification based on patients' clinical visit records, the authors of [123] performed multi-disease prediction for intelligent clinical decision support. A massive dataset of electronic health records was collected from a prominent hospital in southeast China. The suggested LSTM approach outperforms several standard and DL models in predicting future disease diagnoses, according to model evaluation results. The F1 score rises from 78.9 to 86.4 percent, respectively, with the state-of-the-art conventional and DL models, to 88.0 percent with the suggested technique. The authors stated that the model prediction performance may be enhanced further by including new input variables and that to reduce computational complexity, the method only uses one data source.
In [124], the authors introduced an approach to creating a supervised ANN structure based on the subnets (the group of neurons) instead of layers, in the cases of low datasets, this effectively predicted the disease. The model was evaluated using textual data and compared to multilayer perceptrons (MLPs) as well as LSTM recurrent neural network models using three small-scale publicly accessible benchmark datasets. On the Iris dataset, the experimental findings for classification reached 97% accuracy, compared to 92% for RNN (LSTM) with three layers, and the model had a lower error rate, 81, than RNN (LSTM) and MLP on the diabetic dataset, while RNN (LSTM) has a high error rate of 84. For larger datasets, however, this method is useless. This model is useless because it has not been implemented on large textual and image datasets.
The authors of [125] presented a novel AI and Internet of Things (IoT) convergence-based disease detection model for a smart healthcare system. Data collection, reprocessing, categorization, and parameter optimization are all stages of the proposed model. IoT devices, such as wearables and sensors, collect data, which AI algorithms then use to diagnose diseases. The forest technique is then used to remove any outliers found in the patient data. Healthcare data were used to assess the performance of the CSO-LSTM model. During the study, the CSO-LSTM model had a maximum accuracy of 96.16% on heart disease diagnoses and 97.26% on diabetes diagnoses. This method offered a greater prediction accuracy for heart disease and diabetes diagnosis, but there was no feature selection mechanism; hence, it requires extensive computations.
The global health crisis posed by coronaviruses was a subject of [126]. The authors aimed at detecting disease in people whose X-ray had been selected as potential COVID-19 candidates. Chest X-rays of people with COVID-19, viral pneumonia, and healthy people are included in the dataset. The study compared the performance of two DL algorithms, namely CNN and RNN. DL techniques were used to evaluate a total of 657 chest X-ray images for the diagnosis of COVID-19. VGG19 is the most successful model, with a 95% accuracy rate. The VGG19 model successfully categorizes COVID-19 patients, healthy individuals, and viral pneumonia cases. The dataset's most failing approach is InceptionV3. The success percentage can be improved, according to the authors, by improving data collection. In addition to chest radiography, lung tomography can be used. The success ratio and performance can be enhanced by creating numerous DL models.
In [127], the authors developed a method based on the RNN algorithm for predicting blood glucose levels for diabetics a maximum of one hour in the future, which required the patient's glucose level history. The Ohio T1DM dataset for blood glucose level prediction, which included blood glucose level values for six people with type 1 diabetes, was used to train and assess the approach. The distribution features were further honed with the use of studies that revealed the procedure's certainty estimate nature. The authors point out that they can only evaluate prediction goals with enough glucose level history; thus, they cannot anticipate the beginning levels after a gap, which does not improve the prediction's quality.
To build a new deep anomaly detection model for fast, reliable screening, the authors of [128] used an 18-layer residual CNN pre-trained on ImageNet with a different anomaly detection mechanism for the classification of COVID-19. On the X-ray dataset, which contains 100 images from 70 COVID-19 persons and 1431 images from 1008 non-COVID-19 pneumonia subjects, the model obtains a sensitivity of 90.00 percent specificity of 87.84 percent or sensitivity of 96.00 percent specificity of 70.65 percent. The authors noted that the model still has certain flaws, such as missing 4% of COVID-19 cases and having a 30% false positive rate. In addition, more clinical data are required to confirm and improve the model's usefulness.
In [129], the authors developed COVIDX-Net, a novel DL framework that allows radiologists to diagnose COVID-19 in X-ray images automatically. Seven algorithms (MobileNetV2, ResNetV2, VGG19, DenseNet201, InceptionV3, Inception, and Xception) were evaluated using a small dataset of 50 photographs (MobileNetV2, ResNetV2, VGG19, DenseNet201, InceptionV3, Inception, and Xception). Each deep neural network model can classify the patient's status as a negative or positive COVID-19 case based on the normalized intensities of the X-ray image. The f1-scores for the VGG19 and dense convolutional network (DenseNet) models were 0.89 and 0.91, respectively. With f1-scores of 0.67, the InceptionV3 model has the weakest classification performance.
The authors of [130] designed a DL approach for delivering 30-min predictions about future glucose levels based on a Dilated RNN (DRNN). The performance of the DRNN models was evaluated using data from two electronic health records datasets: OhioT1DM from clinical trials and the in silicon dataset from the UVA-Padova simulator. It outperformed established glucose prediction approaches such as neural networks (NNs), support vector regression (SVR), and autoregressive models (ARX). The results demonstrated that it significantly improved glucose prediction performance, although there are still some limits, such as the authors' creation of a data-driven model that heavily relies on past EHR. The quality of the data has a significant impact on the accuracy of the prediction. The number of clinical datasets is limited and , however, often restricted. Because certain data fields are manually entered, they are occasionally incorrect.
In [131], the authors utilized a deep neural network (DNN) to discover 15,099 stroke patients, researchers were able to predict stroke death based on medical history and human behaviors utilizing large-scale electronic health information. The Korea Centers for Disease Control and Prevention collected data from 2013 to 2016 and found that there are around 150 hospitals in the country, all having more than 100 beds. Gender, age, type of insurance, mode of admission, necessary brain surgery, area, length of hospital stays, hospital location, number of hospital beds, stroke kind, and CCI were among the 11 variables in the DL model. To automatically create features from the data and identify risk factors for stroke, researchers used a DNN/scaled principal component analysis (PCA). 15,099 people with a history of stroke were enrolled in the study. The data were divided into a training set (66%) and a testing set (34%), with 30 percent of the samples used for validation in the training set. DNN is used to examine the variables of interest, while scaled PCA is utilized to improve the DNN's continuous inputs. The sensitivity, specificity, and AUC values were 64.32%, 85.56%, and 83.48%, respectively.
The authors of [132] proposed (GluNet), an approach to glucose forecasting. This method made use of a personalized DNN to forecast the probabilistic distribution of short-term measurements for people with Type 1 diabetes based on their historical data. These data included insulin doses, meal information, glucose measurements, and a variety of other factors. It utilized the newest DL techniques consisting of four components: post-processing, dilated CNN, label recovery/ transform, and data preprocessing. The authors run the models on the subjects from the OhioT1DM datasets. The outcomes revealed significant enhancements over the previous procedures via a comprehensive comparison concerning the and root mean square error (RMSE) having a time lag of 60 min prediction horizons (PH) and RMSE having a small-time lag for the case of prediction horizons in the virtual adult participants. If the PH is properly matched to the lag between input and output, the user may learn the control of the system more frequently and it achieves good performance. Additionally, GluNet was validated on two clinical datasets. It attained an RMSE with a time lag of 60 min PH and RMSE with a time lag of 30-min PH. The authors point out that the model does not consider physiological knowledge, and that they need to test GluNet with larger prediction horizons and use it to predict overnight hypoglycemia.
The authors of [133] proposed the short-term blood glucose prediction model (VMD-IPSO-LSTM), which is a short-term strategy for predicting blood glucose (VMD-IPSO-LSTM). Initially, the intrinsic modal functions (IMF) in various frequency bands were obtained using the variational modal decomposition (VMD) technique, which deconstructed the blood glucose content. The short- and long-term memory networks then constructed a prediction mechanism for each blood glucose component’s intrinsic modal functions (IMF). Because the time window length, learning rate, and neuron count are difficult to set, the upgraded PSO approach optimized these parameters. The improved LSTM network anticipated each IMF, and the projected subsequence was superimposed in the final step to arrive at the ultimate prediction result. The data of 56 participants were chosen as experimental data among 451 diabetic Mellitus patients. The experiments revealed that it improved prediction accuracy at "30 min, 45 min, and 60 min." The RMSE and MAPE were lower than the "VMD-PSO-LSTM, VMD-LSTM, and LSTM," indicating that the suggested model is effective. The longer time it took to anticipate blood glucose levels and the higher accuracy of the predictions gave patients and doctors more time to improve the effectiveness of diabetes therapy and manage blood glucose levels. The authors noted that they still faced challenges, such as an increase in calculation volume and operation time. The time it takes to estimate glucose levels in the short term will be reduced.
To speed up diagnosis and cut down on mistakes, the authors of [134] proposed a new paradigm for primary COVID-19 detection based on a radiology review of chest radiography or chest X-ray. The authors used a dataset of chest X-rays from verified COVID-19 patients (408 photographs), confirmed pneumonia patients (4273 images), and healthy people (1590 images) to perform a three-class image classification (1590 images). There are 6271 people in total in the dataset. To fulfill this image categorization problem, the authors plan to use CNN and transfer learning. For all the folds of data, the model's accuracy ranged from 93.90 percent to 98.37 percent. Even the lowest level of accuracy, 93.90 percent, is still quite good. The authors will face a restriction, particularly when it comes to adopting such a model on a large scale for practical usage.
In [135], the authors proposed DL models for predicting the number of COVID-19-positive cases in Indian states. The Ministry of Health and Family Welfare dataset contains time series data for 32 individual confirmed COVID-19 cases in each of the states (28) and union territories (4) since March 14, 2020. This dataset was used to conduct an exploratory analysis of the increase in the number of positive cases in India. As prediction models, RNN-based LSTMs are used. Deep LSTM, convolutional LSTM, and bidirectional LSTM models were tested on 32 states/union territories, and the model with the best accuracy was chosen based on absolute error. Bidirectional LSTM produced the best performance in terms of prediction errors, while convolutional LSTM produced the worst performance. For all states, daily and weekly forecasts were calculated, and bi-LSTM produced accurate results (error less than 3%) for short-term prediction (1–3 days).
With the goal of increasing the reliability and precision of type 1 diabetes predictions, the authors of [136] proposed a new method based on CNNs and DL. It was about figuring out how to extract the behavioral pattern. Numerous observations of identical behaviors were used to fill in the gaps in the data. The suggested model was trained and verified using data from 759 people with type 1 diabetes who visited Sheffield Teaching Hospitals between 2013 and 2015. A subject's type 1 diabetes test, demographic data (age, gender, years with diabetes), and the final 84 days (12 weeks) of self-monitored blood glucose (SMBG) measurements preceding the test formed each item in the training set. In the presence of insufficient data and certain physiological specificities, prediction accuracy deteriorates, according to the authors.
The authors of [137] constructed a framework using the PIDD. PID's participants are all female and at least 21 years old. PID comprises 768 incidences, with 268 samples diagnosed as diabetic and 500 samples not diagnosed as diabetic. The eight most important characteristics that led to diabetes prediction. The accuracy of functional classifiers such as ANN, NB, DT, and DL is between 90 and 98 percent. On the PIMA dataset, DL had the best results for diabetes onset among the four, with an accuracy rate of 98.07 percent. The technique uses a variety of classifiers to accurately predict the disease, but it failed to diagnose it at an early stage.
To summarize all previous works discussed in this section, we will categorize them according to the diseases along with the techniques used to predict each disease, the datasets used, and the main findings, as shown in Table 5.
Results and discussion
This study conducted a systematic review to examine the latest developments in ML and DL for healthcare prediction. It focused on healthcare forecasting and how the use of ML and DL can be relevant and robust. A total of 41 papers were reviewed, 21 in ML and 20 in DL as depicted in Fig. 17.
In this study, the reviewed paper were classified by diseases predicted; as a result, 5 diseases were discussed including diabetes, COVID-19, heart, liver, and chronic kidney). Table 6 illustrates the number of reviewed papers for each disease in addition to the adopted prediction techniques in each disease.
Table 6 provides a comprehensive summary of the various ML and DL models used for disease prediction. It indicates the number of studies conducted on each disease, the techniques employed, and the highest level of accuracy attained. As shown in Table 6, the optimal diagnostic accuracy for each disease varies. For diabetes, the DL model achieved a 98.07% accuracy rate. For COVID-19, the accuracy of the logistic regression model was 98.5%. The CSO-LSTM model achieved an accuracy of 96.16 percent for heart disease. For liver disease, the accuracy of the logistic regression model was 75%. The accuracy of the logistic regression model for predicting multiple diseases was 98.5%. It is essential to note that these are merely the best accuracy included in this survey. In addition, it is essential to consider the size and quality of the datasets used to train and validate the models. It is more likely that models trained on larger and more diverse datasets will generalize well to new data. Overall, the results presented in Table 6 indicate that ML and DL models can be used to accurately predict disease. When selecting a model for a specific disease, it is essential to carefully consider the various models and techniques.
Challenges
Although ML and DL have made incredible strides in recent years, they still have a long way to go before they can effectively be used to solve the fundamental problems plaguing the healthcare systems. Some of the challenges associated with implementing ML and DL approaches in healthcare prediction are discussed here.
The Biomedical Data Stream is the primary challenge that needs to be handled. Significant amounts of new medical data are being generated rapidly, and the healthcare industry as a whole is evolving rapidly. Some examples of such real-time biological signals include measurements of blood pressure, oxygen saturation, and glucose levels. While some variants of DL architecture have attempted to address this problem, many challenges remain before effective analyses of rapidly evolving, massive amounts of streaming data can be conducted. These include problems with memory consumption, feature selection, missing data, and computational complexity. Another challenge for ML and DL is tackling the complexity of the healthcare domain.
Healthcare and biomedical research present more intricate challenges than other fields. There is still a lot we do not know about the origins, transmission, and cures for many of these incredibly diverse diseases. It is hard to collect sufficient data because there are not always enough patients. A solution to this issue may be found, however. The small number of patients necessitates exhaustive patient profiling, innovative data processing, and the incorporation of additional datasets. Researchers can process each dataset independently using the appropriate DL technique and then represent the results in a unified model to extract patient data.
Conclusion
The use of ML and DL techniques for healthcare prediction has the potential to change the way traditional healthcare services are delivered. In the case of ML and DL applications, healthcare data is deemed the most significant component that contributes to medical care systems. This paper aims to present a comprehensive review of the most significant ML and DL techniques employed in healthcare predictive analytics. In addition, it discussed the obstacles and challenges of applying ML and DL Techniques in the healthcare domain. As a result of this survey, a total of 41 papers covering the period from 2019 to 2022 were selected and thoroughly reviewed. In addition, the methodology for each paper was discussed in detail. The reviewed studies have shown that AI techniques (ML and DL) play a significant role in accurately diagnosing diseases and helping to anticipate and analyze healthcare data by linking hundreds of clinical records and rebuilding a patient's history using these data. This work advances research in the field of healthcare predictive analytics using ML and DL approaches and contributes to the literature and future studies by serving as a resource for other academics and researchers.
Availability of data and materials
Not applicable.
Abbreviations
- AI:
-
Artificial Intelligence
- ML:
-
Machine Learning
- DT:
-
Decision Tree
- EHR:
-
Electronic Health Records
- RF:
-
Random Forest
- SVM:
-
Support Vector Machine
- KNN:
-
K-Nearest Neighbor
- NB:
-
Naive Bayes
- RL:
-
Reinforcement Learning
- NLP:
-
Natural Language Processing
- MCTS:
-
Monte Carlo Tree Search
- POMDP:
-
Partially Observable Markov Decision Processes
- DL:
-
Deep Learning
- DBN:
-
Deep Belief Network
- ANNs:
-
Artificial Neural Networks
- CNNs:
-
Convolutional Neural Networks
- LSTM:
-
Long Short-Term Memory
- RCNNs:
-
Recurrent Convolution Neural Networks
- RNNs:
-
Recurrent Neural Networks
- RCL:
-
Recurrent Convolutional Layer
- RFs:
-
Receptive Domains
- RMLP:
-
Recurrent Multilayer Perceptron
- PIDD:
-
Pima Indian Diabetes Database
- CHD:
-
Coronary Heart Disease
- CXR:
-
Chest X-Ray
- MLPs:
-
Multilayer Perceptrons
- IOT:
-
Internet of Things
- DRNN:
-
Dilated RNN
- NNs:
-
Neural Networks
- SVR:
-
Support Vector Regression
- PCA:
-
Principal Component Analysis
- DNN:
-
Deep Neural Network
- PH:
-
Prediction Horizons
- RMSE:
-
Root Mean Square Error
- IMF:
-
Intrinsic Modal Functions
- VMD:
-
Variational Modal Decomposition
- IMF:
-
Intrinsic Modal Functions
- SMBG:
-
Self-Monitored Blood Glucose
References
Latha MH, Ramakrishna A, Reddy BSC, Venkateswarlu C, Saraswathi SY (2022) Disease prediction by stacking algorithms over big data from healthcare communities. Intell Manuf Energy Sustain: Proc ICIMES 2021(265):355
Van Calster B, Wynants L, Timmerman D, Steyerberg EW, Collins GS (2019) Predictive analytics in health care: how can we know it works? J Am Med Inform Assoc 26(12):1651–1654
Sahoo PK, Mohapatra SK, Wu SL (2018) SLA based healthcare big data analysis and computing in cloud network. J Parallel Distrib Comput 119:121–135
Thanigaivasan V, Narayanan SJ, Iyengar SN, Ch N (2018) Analysis of parallel SVM based classification technique on healthcare using big data management in cloud storage. Recent Patents Comput Sci 11(3):169–178
Elmahdy HN (2014) Medical diagnosis enhancements through artificial intelligence
Xiong X, Cao X, Luo L (2021) The ecology of medical care in Shanghai. BMC Health Serv Res 21:1–9
Donev D, Kovacic L, Laaser U (2013) The role and organization of health care systems. Health: systems, lifestyles, policies, 2nd edn. Jacobs Verlag, Lage, pp 3–144
Murphy G F, Hanken M A, & Waters K A (1999) Electronic health records: changing the vision
Qayyum A, Qadir J, Bilal M, Al-Fuqaha A (2020) Secure and robust machine learning for healthcare: a survey. IEEE Rev Biomed Eng 14:156–180
El Seddawy AB, Moawad R, Hana MA (2018) Applying data mining techniques in CRM
Wang Y, Kung L, Wang WYC, Cegielski CG (2018) An integrated big data analytics-enabled transformation model: application to health care. Inform Manag 55(1):64–79
Mirbabaie M, Stieglitz S, Frick NR (2021) Artificial intelligence in disease diagnostics: a critical review and classification on the current state of research guiding future direction. Heal Technol 11(4):693–731
Tang R, De Donato L, Besinović N, Flammini F, Goverde RM, Lin Z, Wang Z (2022) A literature review of artificial intelligence applications in railway systems. Transp Res Part C: Emerg Technol 140:103679
Singh G, Al’Aref SJ, Van Assen M, Kim TS, van Rosendael A, Kolli KK, Dwivedi A, Maliakal G, Pandey M, Wang J, Do V (2018) Machine learning in cardiac CT: basic concepts and contemporary data. J Cardiovasc Comput Tomograph 12(3):192–201
Kim KJ, Tagkopoulos I (2019) Application of machine learning in rheumatic disease research. Korean J Intern Med 34(4):708
Liu B (2011) Web data mining: exploring hyperlinks, contents, and usage data. Spriger, Berlin
Haykin S, Lippmann R (1994) Neural networks, a comprehensive foundation. Int J Neural Syst 5(4):363–364
Gupta M, Pandya SD (2022) A comparative study on supervised machine learning algorithm. Int J Res Appl Sci Eng Technol (IJRASET) 10(1):1023–1028
Ray S (2019) A quick review of machine learning algorithms. In: 2019 international conference on machine learning, big data, cloud and parallel computing (COMITCon) (pp 35–39). IEEE
Srivastava A, Saini S, & Gupta D (2019) Comparison of various machine learning techniques and its uses in different fields. In: 2019 3rd international conference on electronics, communication and aerospace technology (ICECA) (pp 81–86). IEEE
Park HA (2013) An introduction to logistic regression: from basic concepts to interpretation with particular attention to nursing domain. J Korean Acad Nurs 43(2):154–164
Obulesu O, Mahendra M, & Thrilok Reddy M (2018) Machine learning techniques and tools: a survey. In: 2018 international conference on inventive research in computing applications (ICIRCA) (pp 605–611). IEEE
Dhall D, Kaur R, & Juneja M (2020) Machine learning: a review of the algorithms and its applications. Proceedings of ICRIC 2019: recent innovations in computing 47–63
Yang F J (2019) An extended idea about Decision Trees. In: 2019 international conference on computational science and computational intelligence (CSCI) (pp 349–354). IEEE
Eesa AS, Orman Z, Brifcani AMA (2015) A novel feature-selection approach based on the cuttlefish optimization algorithm for intrusion detection systems. Expert Syst Appl 42(5):2670–2679
Shamim A, Hussain H, & Shaikh M U (2010) A framework for generation of rules from Decision Tree and decision table. In: 2010 international conference on information and emerging technologies (pp 1–6). IEEE
Eesa AS, Abdulazeez AM, Orman Z (2017) A dids based on the combination of cuttlefish algorithm and Decision Tree. Sci J Univ Zakho 5(4):313–318
Bakyarani ES, Srimathi H, Bagavandas M (2019) A survey of machine learning algorithms in health care. Int J Sci Technol Res 8(11):223
Resende PAA, Drummond AC (2018) A survey of random forest based methods for intrusion detection systems. ACM Comput Surv (CSUR) 51(3):1–36
Breiman L (2001) Random forests. Mach learn 45:5–32
Ho TK (1998) The random subspace method for constructing decision forests. IEEE Trans Pattern Anal Mach Intell 20(8):832–844
Hofmann M, & Klinkenberg R (2016) RapidMiner: data mining use cases and business analytics applications. CRC Press
Chow CKCN, Liu C (1968) Approximating discrete probability distributions with dependence trees. IEEE Trans Inf Theory 14(3):462–467
Burges CJ (1998) A tutorial on support vector machines for pattern recognition. Data Min Knowl Disc 2(2):121–167
Han J, Pei J, Kamber M (1999) Data mining: concepts and techniques. 2011
Cortes C, Vapnik V (1995) Support-vector networks. Mach learn 20:273–297
Aldahiri A, Alrashed B, Hussain W (2021) Trends in using IoT with machine learning in health prediction system. Forecasting 3(1):181–206
Sarker IH (2021) Machine learning: Algorithms, real-world applications and research directions. SN Comput Sci 2(3):160
Ting K M, & Zheng Z (1999) Improving the performance of boosting for naive Bayesian classification. In: Methodologies for knowledge discovery and data mining: third Pacific-Asia conference, PAKDD-99 Beijing, China, Apr 26–28, 1999 proceedings 3 (pp 296–305). Springer Berlin Heidelberg
Oladipo ID, AbdulRaheem M, Awotunde JB, Bhoi AK, Adeniyi EA, Abiodun MK (2022) Machine learning and deep learning algorithms for smart cities: a start-of-the-art review. In: IoT and IoE driven smart cities, pp 143–162
Shailaja K, Seetharamulu B, & Jabbar M A Machine learning in healthcare: a review. In: 2018 second international conference on electronics, communication and aerospace technology (ICECA) 2018 Mar 29 (pp 910–914)
Mahesh B (2020) Machine learning algorithms-a review. Int J Sci Res (IJSR) 9:381–386
Greene D, Cunningham P, & Mayer R (2008) Unsupervised learning and clustering. Mach learn Techn Multimed: Case Stud Organ Retriev 51–90
Jain AK, Dubes RC (1988) Algorithms for clustering data. Prentice-Hall, Inc, USA
Kodinariya TM, Makwana PR (2013) Review on determining number of cluster in K-means clustering. Int J 1(6):90–95
Smith LI (2002) A tutorial on principal components analysis
Mishra SP, Sarkar U, Taraphder S, Datta S, Swain D, Saikhom R, Laishram M (2017) Multivariate statistical data analysis-principal component analysis (PCA). Int J Livestock Res 7(5):60–78
Kamani M, Farzin Haddadpour M, Forsati R, and Mahdavi M (2019) "Efficient Fair Principal Component Analysis." arXiv e-prints: arXiv-1911.
Dey A (2016) Machine learning algorithms: a review. Int J Comput Sci Inf Technol 7(3):1174–1179
Agrawal R, Imieliński T, & Swami A (1993) Mining association rules between sets of items in large databases. In: proceedings of the 1993 ACM SIGMOD international conference on Management of data (pp 207–216)
Agrawal R, & Srikant R (1994) Fast algorithms for mining association rules. In: Proceeding of 20th international conference very large data bases, VLDB (Vol 1215, pp 487-499)
Singh J, Ram H, Sodhi DJ (2013) Improving efficiency of apriori algorithm using transaction reduction. Int J Sci Res Publ 3(1):1–4
Al-Maolegi M, & Arkok B (2014) An improved Apriori algorithm for association rules. arXiv preprint arXiv:1403.3948
Abaya SA (2012) Association rule mining based on Apriori algorithm in minimizing candidate generation. Int J Sci Eng Res 3(7):1–4
Coronato A, Naeem M, De Pietro G, Paragliola G (2020) Reinforcement learning for intelligent healthcare applications: a survey. Artif Intell Med 109:101964
Watkins CJ, Dayan P (1992) Q-learning. Mach Learn 8:279–292
Jang B, Kim M, Harerimana G, Kim JW (2019) Q-learning algorithms: a comprehensive classification and applications. IEEE access 7:133653–133667
Achille A, Soatto S (2018) Information dropout: Learning optimal representations through noisy computation. IEEE Trans Pattern Anal Mach Intell 40(12):2897–2905
Williams G, Wagener N, Goldfain B, Drews P, Rehg J M, Boots B, & Theodorou E A (2017) Information theoretic MPC for model-based reinforcement learning. In: 2017 IEEE international conference on robotics and automation (ICRA) (pp 1714–1721). IEEE
Wilkes JT, Gallistel CR (2017) Information theory, memory, prediction, and timing in associative learning. Comput Models Brain Behav 29:481–492
Ning Y, Jia J, Wu Z, Li R, An Y, Wang Y, Meng H (2017) Multi-task deep learning for user intention understanding in speech interaction systems. In: Proceedings of the AAAI conference on artificial intelligence (Vol 31, No. 1)
Shi X, Gao Z, Lausen L, Wang H, Yeung DY, Wong WK, Woo WC (2017) Deep learning for precipitation nowcasting: a benchmark and a new model. In: Guyon I, Von Luxburg U, Bengio S, Wallach H, Fergus R, Vishwanathan S, Garnett R (Eds) Advances in neural information processing systems, vol 30. Curran Associates, Inc.,. https://proceedings.neurips.cc/paper_files/paper/2017/file/a6db4ed04f1621a119799fd3d7545d3d-Paper.pdf
Juang CF, Lu CM (2009) Ant colony optimization incorporated with fuzzy Q-learning for reinforcement fuzzy control. IEEE Trans Syst, Man, Cybernet-Part A: Syst Humans 39(3):597–608
Świechowski M, Godlewski K, Sawicki B, Mańdziuk J (2022) Monte Carlo tree search: a review of recent modifications and applications. Artif Intell Rev 56:1–66
Lizotte DJ, Laber EB (2016) Multi-objective Markov decision processes for data-driven decision support. J Mach Learn Res 17(1):7378–7405
Silver D, Huang A, Maddison CJ, Guez A, Sifre L, Van Den Driessche G, Hassabis D (2016) Mastering the game of go with deep neural networks and tree search. Nature 529(7587):484–489
Browne CB, Powley E, Whitehouse D, Lucas SM, Cowling PI, Rohlfshagen P, Colton S (2012) A survey of monte carlo tree search methods. IEEE Trans Comput Intell AI Games 4(1):1–43
Ling ZH, Kang SY, Zen H, Senior A, Schuster M, Qian XJ, Deng L (2015) Deep learning for acoustic modeling in parametric speech generation: a systematic review of existing techniques and future trends. IEEE Signal Process Magaz 32(3):35–52
Schmidhuber J (2015) Deep learning in neural networks: an overview. Neural Netw 61:85–117
Yu D, Deng L (2010) Deep learning and its applications to signal and information processing [exploratory dsp]. IEEE Signal Process Mag 28(1):145–154
Hinton GE, Osindero S, Teh YW (2006) A fast learning algorithm for deep belief nets. Neural Comput 18(7):1527–1554
Goyal P, Pandey S, Jain K, Goyal P, Pandey S, Jain K (2018) Introduction to natural language processing and deep learning. Deep Learn Nat Language Process: Creat Neural Netw Python 1–74. https://doi.org/10.1007/978-1-4842-3685-7
Mathew A, Amudha P, Sivakumari S (2021) Deep learning techniques: an overview. Adv Mach Learn Technol Appl: Proc AMLTA 2020:599–608
Goodfellow I, Bengio Y, Courville A (2016) Deep learning. MIT press, USA
Gomes L (2014) Machine-learning maestro Michael Jordan on the delusions of big data and other huge engineering efforts. IEEE Spectrum 20. https://spectrum.ieee.org/machinelearning-maestro-michael-jordan-on-the-delusions-of-big-data-and-other-huge-engineering-efforts
Huang G, Liu Z, Van Der Maaten L, & Weinberger K Q (2017) Densely connected convolutional networks. In: proceedings of the IEEE conference on computer vision and pattern recognition (pp 4700–4708)
Yap MH, Pons G, Marti J, Ganau S, Sentis M, Zwiggelaar R, Marti R (2017) Automated breast ultrasound lesions detection using convolutional neural networks. IEEE J Biomed Health Inform 22(4):1218–1226
Hayashi Y (2019) The right direction needed to develop white-box deep learning in radiology, pathology, and ophthalmology: a short review. Front Robot AI 6:24
Alom MZ, Taha TM, Yakopcic C, Westberg S, Sidike P, Nasrin MS, Asari VK (2019) A state-of-the-art survey on deep learning theory and architectures. Electronics 8(3):292
Schmidhuber J, Hochreiter S (1997) Long short-term memory. Neural Comput 9(8):1735–1780
Smagulova K, James AP (2019) A survey on LSTM memristive neural network architectures and applications. Eur Phys J Spec Topics 228(10):2313–2324
Setyanto A, Laksito A, Alarfaj F, Alreshoodi M, Oyong I, Hayaty M, Kurniasari L (2022) Arabic language opinion mining based on long short-term memory (LSTM). Appl Sci 12(9):4140
Lindemann B, Müller T, Vietz H, Jazdi N, Weyrich M (2021) A survey on long short-term memory networks for time series prediction. Procedia CIRP 99:650–655
Cui Z, Ke R, Pu Z, & Wang Y (2018) Deep bidirectional and unidirectional LSTM recurrent neural network for network-wide traffic speed prediction. arXiv preprint arXiv:1801.02143
Villegas R, Yang J, Zou Y, Sohn S, Lin X, & Lee H (2017) Learning to generate long-term future via hierarchical prediction. In: international conference on machine learning (pp 3560–3569). PMLR
Gensler A, Henze J, Sick B, & Raabe N (2016) Deep learning for solar power forecasting—an approach using autoencoder and LSTM neural networks. In: 2016 IEEE international conference on systems, man, and cybernetics (SMC) (pp 002858–002865). IEEE
Lindemann B, Fesenmayr F, Jazdi N, Weyrich M (2019) Anomaly detection in discrete manufacturing using self-learning approaches. Procedia CIRP 79:313–318
Kalchbrenner N, Danihelka I, & Graves A (2015) Grid long short-term memory. arXiv preprint arXiv:1507.01526
Cheng B, Xu X, Zeng Y, Ren J, Jung S (2018) Pedestrian trajectory prediction via the social-grid LSTM model. J Eng 2018(16):1468–1474
Veličković P, Karazija L, Lane N D, Bhattacharya S, Liberis E, Liò P & Vegreville M (2018) Cross-modal recurrent models for weight objective prediction from multimodal time-series data. In: proceedings of the 12th EAI international conference on pervasive computing technologies for healthcare (pp 178–186)
Wang J, Hu X (2021) Convolutional neural networks with gated recurrent connections. IEEE Trans Pattern Anal Mach Intell 44(7):3421–3435
Liang M, & Hu X (2015) Recurrent convolutional neural network for object recognition. In: proceedings of the IEEE conference on computer vision and pattern recognition (pp 3367–3375)
Liang M, Hu X, Zhang B (2015) Convolutional neural networks with intra-layer recurrent connections for scene labeling. In: Cortes C, Lawrence N, Lee D, Sugiyama M, Garnett R (Eds) Advances in Neural Information Processing Systems, vol 28. Curran Associates, Inc. https://proceedings.neurips.cc/paper_files/paper/2015/file/9cf81d8026a9018052c429cc4e56739b-Paper.pdf
Fernandez B, Parlos A G, & Tsai W K (1990) Nonlinear dynamic system identification using artificial neural networks (ANNs). In: 1990 IJCNN international joint conference on neural networks (pp 133–141). IEEE
Puskorius GV, Feldkamp LA (1994) Neurocontrol of nonlinear dynamical systems with Kalman filter trained recurrent networks. IEEE Trans Neural Netw 5(2):279–297
Rumelhart DE (1986) Learning representations by error propagation. In: DE Rumelhart and JL McClelland & PDP Research Group, eds, Parallel distributed processing: explorations in the microstructure of cognition. Bradford Books MITPress, Cambridge, Mass
Krishnamoorthi R, Joshi S, Almarzouki H Z, Shukla P K, Rizwan A, Kalpana C, & Tiwari B (2022) A novel diabetes healthcare disease prediction framework using machine learning techniques. J Healthcare Eng. https://doi.org/10.1155/2022/1684017
Edeh MO, Khalaf OI, Tavera CA, Tayeb S, Ghouali S, Abdulsahib GM, Louni A (2022) A classification algorithm-based hybrid diabetes prediction model. Front Publ Health 10:829510
Iwendi C, Huescas C G Y, Chakraborty C, & Mohan S (2022) COVID-19 health analysis and prediction using machine learning algorithms for Mexico and Brazil patients. J Experiment Theor Artif Intell 1–21. https://doi.org/10.1080/0952813X.2022.2058097
Lu H, Uddin S, Hajati F, Moni MA, Khushi M (2022) A patient network-based machine learning model for disease prediction: the case of type 2 diabetes mellitus. Appl Intell 52(3):2411–2422
Chugh M, Johari R, & Goel A (2022) MATHS: machine learning techniques in healthcare system. In: international conference on innovative computing and communications: proceedings of ICICC 2021, Volume 3 (pp 693–702). Springer Singapore
Deberneh HM, Kim I (2021) Prediction of type 2 diabetes based on machine learning algorithm. Int J Environ Res Public Health 18(6):3317
Gupta S, Verma H K, & Bhardwaj D (2021) Classification of diabetes using Naive Bayes and support vector machine as a technique. In: operations management and systems engineering: select proceedings of CPIE 2019 (pp 365–376). Springer Singapore
Islam M T, Rafa S R, & Kibria M G (2020) Early prediction of heart disease using PCA and hybrid genetic algorithm with k-means. In: 2020 23rd international conference on computer and information technology (ICCIT) (pp 1–6). IEEE
Qawqzeh Y K, Bajahzar A S, Jemmali M, Otoom M M, Thaljaoui A (2020) Classification of diabetes using photoplethysmogram (PPG) waveform analysis: logistic regression modeling. BioMed Res Int. https://doi.org/10.1155/2020/3764653
Grampurohit S, Sagarnal C (2020) Disease prediction using machine learning algorithms. In: 2020 international conference for emerging technology (INCET) (pp 1–7). IEEE
Moturi S, Srikanth Vemuru DS (2020) Classification model for prediction of heart disease using correlation coefficient technique. Int J 9(2). https://doi.org/10.30534/ijatcse/2020/185922020
Barik S, Mohanty S, Rout D, Mohanty S, Patra A K, & Mishra A K (2020) Heart disease prediction using machine learning techniques. In: advances in electrical control and signal systems: select proceedings of AECSS 2019 (pp 879–888). Springer, Singapore
Princy R J P, Parthasarathy S, Jose P S H, Lakshminarayanan A R, & Jeganathan S (2020) Prediction of cardiac disease using supervised machine learning algorithms. In: 2020 4th international conference on intelligent computing and control systems (ICICCS) (pp 570–575). IEEE
Saw M, Saxena T, Kaithwas S, Yadav R, & Lal N (2020) Estimation of prediction for getting heart disease using logistic regression model of machine learning. In: 2020 international conference on computer communication and informatics (ICCCI) (pp 1–6). IEEE
Soni VD (2020) Chronic disease detection model using machine learning techniques. Int J Sci Technol Res 9(9):262–266
Indrakumari R, Poongodi T, Jena SR (2020) Heart disease prediction using exploratory data analysis. Procedia Comput Sci 173:130–139
Wu C S M, Badshah M, & Bhagwat V (2019) Heart disease prediction using data mining techniques. In: proceedings of the 2019 2nd international conference on data science and information technology (pp 7–11)
Tarawneh M, & Embarak O (2019) Hybrid approach for heart disease prediction using data mining techniques. In: advances in internet, data and web technologies: the 7th international conference on emerging internet, data and web technologies (EIDWT-2019) (pp 447–454). Springer International Publishing
Rahman AS, Shamrat FJM, Tasnim Z, Roy J, Hossain SA (2019) A comparative study on liver disease prediction using supervised machine learning algorithms. Int J Sci Technol Res 8(11):419–422
Gonsalves A H, Thabtah F, Mohammad R M A, & Singh G (2019) Prediction of coronary heart disease using machine learning: an experimental analysis. In: proceedings of the 2019 3rd international conference on deep learning technologies (pp 51–56)
Khan A, Uddin S, Srinivasan U (2019) Chronic disease prediction using administrative data and graph theory: the case of type 2 diabetes. Expert Syst Appl 136:230–241
Alanazi R (2022) Identification and prediction of chronic diseases using machine learning approach. J Healthcare Eng. https://doi.org/10.1155/2022/2826127
Gouda W, Almurafeh M, Humayun M, Jhanjhi NZ (2022) Detection of COVID-19 based on chest X-rays using deep learning. Healthcare 10(2):343
Kumar A, Satyanarayana Reddy S S, Mahommad G B, Khan B, & Sharma R (2022) Smart healthcare: disease prediction using the cuckoo-enabled deep classifier in IoT framework. Sci Progr. https://doi.org/10.1155/2022/2090681
Monday H N, Li J P, Nneji G U, James E C, Chikwendu I A, Ejiyi C J, & Mgbejime G T (2021) The capability of multi resolution analysis: a case study of COVID-19 diagnosis. In: 2021 4th international conference on pattern recognition and artificial intelligence (PRAI) (pp 236–242). IEEE
Al Rahhal MM, Bazi Y, Jomaa RM, Zuair M, Al Ajlan N (2021) Deep learning approach for COVID-19 detection in computed tomography images. Cmc-Comput Mater Continua 67(2):2093–2110
Men L, Ilk N, Tang X, Liu Y (2021) Multi-disease prediction using LSTM recurrent neural networks. Expert Syst Appl 177:114905
Ahmad U, Song H, Bilal A, Mahmood S, Alazab M, Jolfaei A & Saeed U (2021) A novel deep learning model to secure internet of things in healthcare. Mach Intell Big Data Anal Cybersec Appl 341–353
Mansour RF, El Amraoui A, Nouaouri I, Díaz VG, Gupta D, Kumar S (2021) Artificial intelligence and internet of things enabled disease diagnosis model for smart healthcare systems. IEEE Access 9:45137–45146
Sevi M, & Aydin İ (2020) COVID-19 detection using deep learning methods. In: 2020 international conference on data analytics for business and industry: way towards a sustainable economy (ICDABI) (pp 1–6). IEEE
Martinsson J, Schliep A, Eliasson B, Mogren O (2020) Blood glucose prediction with variance estimation using recurrent neural networks. J Healthc Inform Res 4:1–18
Zhang J, Xie Y, Pang G, Liao Z, Verjans J, Li W, Xia Y (2020) Viral pneumonia screening on chest X-rays using confidence-aware anomaly detection. IEEE Trans Med Imaging 40(3):879–890
Hemdan E E D, Shouman M A, & Karar M E (2020) Covidx-net: a framework of deep learning classifiers to diagnose covid-19 in x-ray images. arXiv preprint arXiv:2003.11055
Zhu T, Li K, Chen J, Herrero P, Georgiou P (2020) Dilated recurrent neural networks for glucose forecasting in type 1 diabetes. J Healthc Inform Res 4:308–324
Cheon S, Kim J, Lim J (2019) The use of deep learning to predict stroke patient mortality. Int J Environ Res Public Health 16(11):1876
Li K, Liu C, Zhu T, Herrero P, Georgiou P (2019) GluNet: a deep learning framework for accurate glucose forecasting. IEEE J Biomed Health Inform 24(2):414–423
Wang W, Tong M, Yu M (2020) Blood glucose prediction with VMD and LSTM optimized by improved particle swarm optimization. IEEE Access 8:217908–217916
Rashid N, Hossain M A F, Ali M, Sukanya M I, Mahmud T, & Fattah S A (2020) Transfer learning based method for COVID-19 detection from chest X-ray images. In: 2020 IEEE region 10 conference (TENCON) (pp 585–590). IEEE
Arora P, Kumar H, Panigrahi BK (2020) Prediction and analysis of COVID-19 positive cases using deep learning models: a descriptive case study of India. Chaos, Solitons Fractals 139:110017
Zaitcev A, Eissa MR, Hui Z, Good T, Elliott J, Benaissa M (2020) A deep neural network application for improved prediction of in type 1 diabetes. IEEE J Biomed Health Inform 24(10):2932–2941
Naz H, Ahuja S (2020) Deep learning approach for diabetes prediction using PIMA Indian dataset. J Diabetes Metab Disord 19:391–403
Acknowledgements
Not applicable.
Funding
Not applicable.
Author information
Authors and Affiliations
Contributions
MB wrote the main text of the manuscript; NR and HAH revised the manuscript. All authors read and approved the final manuscript.
Corresponding author
Ethics declarations
Competing interests
The authors declare that they have no competing interests. All authors approved the final manuscript.
Additional information
Publisher's Note
Springer Nature remains neutral with regard to jurisdictional claims in published maps and institutional affiliations.
Rights and permissions
Open Access This article is licensed under a Creative Commons Attribution 4.0 International License, which permits use, sharing, adaptation, distribution and reproduction in any medium or format, as long as you give appropriate credit to the original author(s) and the source, provide a link to the Creative Commons licence, and indicate if changes were made. The images or other third party material in this article are included in the article's Creative Commons licence, unless indicated otherwise in a credit line to the material. If material is not included in the article's Creative Commons licence and your intended use is not permitted by statutory regulation or exceeds the permitted use, you will need to obtain permission directly from the copyright holder. To view a copy of this licence, visit http://creativecommons.org/licenses/by/4.0/.
About this article

Cite this article
Badawy, M., Ramadan, N. & Hefny, H.A. Healthcare predictive analytics using machine learning and deep learning techniques: a survey. Journal of Electrical Systems and Inf Technol 10, 40 (2023). https://doi.org/10.1186/s43067-023-00108-y
Received:
Accepted:
Published:
DOI: https://doi.org/10.1186/s43067-023-00108-y