- Research
- Open access
- Published:
K-means clustering of electricity consumers using time-domain features from smart meter data
Journal of Electrical Systems and Information Technology volume 10, Article number: 2 (2023)
Abstract
Smart meter stores electricity consumption data of every consumer in the smart grid system. A better understanding of consumption behaviors and an effective consumer classification based on the similarity of these behaviors can be helpful for flexible demand management and effective energy control. In this paper, we propose an implementation of unsupervised classification for categorizing consumers based on the similarity of their typical electricity consumption behaviors. The main goal is to group similar observations together in order to easily look at the dataset. Hence, we go through pattern identification in households’ consumption with the K-means clustering algorithm. K-means clusters consumption behaviors based on extracted temporal features into k groups. The result from the algorithm helps power suppliers to understand power consumers’ better and helps them make better informed decision based on the information available to them. The dataset used in this paper is a real data from the London Data Store energy consumption readings for a sample of 5567 London Households that took part in the UK Power Networks Led Low Carbon London project between November 2011 and February 2014 available at: https://data.london.gov.uk/dataset/smartmeter-energy-use-data-in-london-households.
Introduction
Smart grid (SG) is a cutting-edge computerized electrical network working with advanced technologies. It is more secure than the traditional electrical grid that allows a bidirectional flow of energy and communication signals between the utility and consumers. The SG helps to easily monitor, automate and manage the increasing complexity of electricity needs in the twenty-first century. It is an intelligent electric power infrastructure that was developed to overcome the challenges of the conventional power grid [1]. The SG self-heals, motivates and allows the consumers resist physical and cyber-attacks, increases power quality, accommodates all generations and storage options, enables new products, services and markets, optimizes assets, and operates efficiently. It increases the possibilities of distributed generation, bringing generation closer to those it serves (i.e., solar panels on the roof rather than some distant power station).
Owing to population growth and the exponential increase in the number of power-hungry digital components in our digital economy, additional infrastructure must be built. Be it smart or otherwise, the overall benefits of such efforts outweigh the costs. SGs or the updated version of traditional “dumb” energy infrastructures stand as the key and vital items supporting the concept of a sustainable future city [2]. SGs require smart metering, communications, and control strategies across the entire distribution system to optimize the delivery of electricity, integrating distributed energy resources (DERs), and engaging customers with technologies and incentives to accommodate cost and efficiency considerations [3, 4].
Smart meters in a SG can be used as sensors to detect problems and variations in the energy supply and consumption system. Smart meter data offers a unique opportunity to understand a consumer’s energy use pattern. It is essential for achieving a better understanding of electricity consumption behaviors, flexible demand management, and effective energy control. Electricity end consumers optimize daily energy cost according to an understanding of their consumption patterns to reduce energy cost.
The existing grid system is becoming obsolete and questionable as it cannot detect problems in real-time. The concept of demand and supply as commonly used in other industries is applied in this paper to reveal the current grid struggles in a power-hungry society where the need for electrical energy is constantly on the rise. To determine demand flexibility, a deeper understanding of consumption trends is required. Accurate load profiling based on consumption pattern similarity is required to help electricity suppliers in terms of designing specific tariff options and efficient power supply plans. Data mining approach is used to analyze the London smart meter dataset comprehensively for consumer categorization. Clustering which is one of the most important unsupervised classification techniques is used to understand electricity consumption patterns [5, 6].
The current available consumption measurements are highly dimensional and too bulky for load analysis and hence unsuitable. This calls for feature extraction. A deeper knowledge of consumer features and an efficient grouping or categorization based on similarities of their consumption patterns may be useful for adaptive demand management, effective energy usage, and sustainable transition in the energy sector. We therefore divide electricity consumers into three categories: residential, commercial, and industrial. Even for a specific category, the consumers can have varied consumption behaviors. For example, a factory and a hotel both belong to the commercial type, but can have distinct load patterns. Thus, the categorization of electricity consumers should be centered on their load pattern similarities rather than their types to further analyze their behaviors in terms of electricity consumption [7, 8].
This paper analyzes sophisticated time-series data generated by smart meters after it has been collected from the meter data management systems to better understand consumer behaviors and further group electrical energy consumers based on their load pattern similarity. It is on this premise that we tend to use temporal features to categorize consumers based on load pattern similarities to reduce the size of the dataset for easier load analysis.
The structure of this paper is presented as follows: “Introduction” section presents the introduction, “Related Work” section surveys related works emphasizing the state of the art in the field of consumer categorization. “Methodology” section presents the methodology applied in the paper. “Analysis” section presents the application of the methodology described in “Methodology” section to the dataset followed by results and discussion in “Model Evaluation” section. Finally, conclusion and references are presented.
Related work
Several researchers have applied wide-range of analysis on time-series data using various clustering techniques and features and have obtained good results. Dimensionality reduction is paramount in cluster analysis to reduce the use of computation resources. Principal component analysis (PCA) was applied by [3, 9] for feature extraction and dimensionality reduction on a large dataset of 250,000 customers in Tulkarm district. Results show that three features explain approximately 95.3% maximum variance of the features in the dataset. K-means was used as the clustering technique and for effective planning and implementation of energy efficiency programs. To address the issue of information loss when using dimension reduction techniques in characterizing smart meter data, Oyedokun et al. [10] proposed a data mining framework involving k-medoid clustering technique and a dynamic time warping (DTW) distance measure. They used it to cluster the characterized smart meter data to identify consumers by their per unit variability peak contributions. The cluster optimization (COP) index cluster validation technique is used to determine the optimal number of clusters. The performance of the proposed methodology is evaluated using the publicly available Irish daily load curve 30 min interval smart meter data comprising of 99 customer records. Funde et al. [11] determined energy consumption patterns using motif-based association rule mining and clustering. Implementation of simple API for XML (SAX) was used to transform time-series data into symbolic representations. A unique combination of SAX, temporal motif discovery, and association rule mining was used for extraction of temporal information in smart meter data, detection of expected and unexpected energy usage patterns in smart meter data. k-medoid clustering is applied to determine the daily profiles with Euclidean distance measure. To evaluate the chosen clustering technique, sum of square error (SSE) and silhouette coefficient were used. Results from this study confirmed the identification of distinct clusters for similar consumption patterns and the formation of a motif-based signature for each smart meter used in the identification of normal and abnormal energy usage. The authors in [12] investigated the impact of normalization, wavelet transformation, and autocorrelation feature extraction to enable K-means to evaluate autocorrelation, avoid overlapping, and account for temporal components in the data for an increase in clustering performance [6, 13,14,15]. The cluster validation indices (CVIs) used in the paper are mean index adequacy (MIA), clustering dispersion index (CDI), Davies–Bouldin index (DBI) and the silhouette index. The results indicate that significant autocorrelation coefficients were extracted and incorporated into clustering using K-means and also proved that data transformation before clustering could help produce better-defined clusters. A case study of Kunshan City, Jiangsu Province, China, using the daily electricity consumption data of 1312 low-voltage users within a month was presented by [8, 16] to explore direct cluster analysis in determining daily electricity consumption patterns of low-voltage residential users using a process model based on Fuzzy C-Means (FCM) clustering method and fuzzy cluster validity index (PBMF). User groups with similar electricity consumption patterns were discovered, which are of great significance for smart power decision making.
Methodology
Figure 1 shows the theoretical statistical framework that we used to analyze the smart meter data and illustrates the procedures of the clustering system and the techniques.

Process model of consumer categorization
Data collection
The data used for this paper were collected as energy consumption readings for a sample of 5567 London households that took part in the UK Power Networks Led Low Carbon London project between November 2011 and February 2014. Readings were taken at half-hourly intervals. Households have been allocated to consolidated analysis center incorporated (CACI) Acorn Group (2010).The customers in the trial were recruited as a balanced sample representative of the greater London population. The dataset contains energy consumption in kWh (per half hour), unique household identifier, date and time, and CACI Acorn group. The comma separated values (CSV) file is approximately 10 GB when unzipped and contains around 167 million records.
There are two groups of clients in the dataset. A subset of 1100 customers (Dynamic Time of Use or DToU) were assigned specific hours when their electricity rate was higher or lower than the normal price—high (67.20 p/kWh), low (3.99p/kWh), or normal (11.76p/kWh). The rest of the sample (approximately 4500) was a fixed rate of 14.228p/kWh. The dataset description is shown in Table 1.
2Data pre-processing/cleaning
Real-world data are incomplete, inconsistent, inaccurate along with errors, outliers, or missing values, we therefore pre-process/clean the data to improve on the data quality and extract meaningful relations from the data to promote error detection and correction, outlier detection, normalization, standardization, and so on. Again sample data with missing values or zero values were removed from the dataset. At this stage, the data are normalized between 0 and 1.0. The justification for normalization is to reduce the impact of magnitude on the process of clustering to allow magnitude-bias cluster formation. We further normalize the datasets features to enable Euclidean distance or other distance measures. There are several methods for data normalization (e.g., z-score normalization, normalization by decimal scaling and so on), but this paper used MinMax normalization method.
Data visualization
Graphic displays are often very effective at communicating information. Visualization via charts, graphs, and images is an effective and efficient way to interpret and understand data and help spot valuable information such as patterns, trends, and anomalies [17]. The reason is that graphs, unlike tables and written text, are primarily visual and approximately 70% of our sense receptors are dedicated to vision. Its main goal is to distill large datasets into visual graphics to allow for an easy understanding of complex relationships within the data.
Feature extraction
In this paper, time-domain features also called temporal features are extracted from the smart meter data and applied on the clustering model for consumer categorization. The smart meter can be set to have various resolutions such as 1 h, 30 min, 15 min, and 1 min generating 24, 48, 96, and 1440 measurements, respectively, per day. This explicitly demonstrates the influence of the sampling rate on the dimensionality of the data in the time-series. Specifically, the processing of such large datasets may be a daunting challenge for electrical utilities. This calls for machine learning (ML) model particularly for unsupervised learning methods that do not have access to labeled training data. New features can capture information that is unavailable from the default features in a dataset. The default features here refer to the power consumption measurements at all-time points. The most critical part of a good clustering is theoretically selecting the right attributes. Maybe more important than the clustering approaches are the attributes that are clustered. Likewise, selecting a minimal number of features demands that they explain as much detail as possible to be usable. This is especially difficult when considering household demand at highly unpredictable levels. Before the key clustering phase, the smart meter data obtained is analyzed in several ways to minimize the size of input data or to identify more useful features for consumer categorization.
Clustering
K-means is applied to the extracted temporal components to categorize consumer daily load curves into distinct clusters according to their consumption patterns—see Fig. 2. K-means is a simple, fast, robust and has temporal resolution effects and possess efficient shape-preserving algorithm for clustering data. This statistical clustering technique is used in this paper because of its consistency, reliability, and scalability. It is based on the category of centroid-based clustering, i.e., partition-based clustering method.

Flowchart of K-means algorithm implementation
In this algorithm, partitioning a dataset D of n objects into a set of k clusters, such that the sum of squared distances called the Euclidean distance is minimized, which is its fundamental principle. The objective function is shown in Eq. 1. The K-means algorithm aims at minimizing an objective function know as squared error function given as
where ‘ci’ is the number of data points in ith cluster. ‘c’ is the number of cluster centers.
\(\left\| {x_{i} - c_{j} } \right\|^{2}\) is the Euclidean distance between xi and cj, that is the distance between a data point xi and the centroid cj, which is an indicator of the distance of the n data points from their respective centroids. In other words, for each object in each cluster, the distance from the object to its cluster center is squared, and the distances are summed. This criterion tries to make the resulting K clusters as compact and as separate as possible. Nevertheless, the K-means algorithm requires knowing the number of clusters that can be used in advance. For that purpose, the Elbow Method is implemented.
Elbow method
The paper uses the elbow method to determine the optimal number of clusters in the K-means clustering. The elbow method runs K-means clustering on the dataset for a range of values for k (e.g., from 1 to 10) and then each value of k computes an average score for all clusters. By default, the within-cluster sum of squares (WCSS) which is also called the sum of squared errors (SSE) is computed for the random number of clusters and an optimal number is chosen and plotted.
Evaluation of clustering results
Since clustering is an unsupervised process, the load data objects in datasets are unlabeled and no structural knowledge about the dataset is available. Hence, measuring the quality of clustering results and determining the optimal number of clusters is the same task. The defined clusters can be evaluated for compactness by choosing the best number of clusters. The most commonly used approach to determine the optimal number of clusters is to execute the clustering algorithm several times with a different number of clusters. This provides the best result in observing a predefined criterion function called cluster validity indicator or indices (CVI). When the number of clusters and other parameters of clustering are fixed, CVI can be used to evaluate and validate the results of load classification. Previous studies on CVI have demonstrated that no single CVI performs better than the others [5, 13, 14], but they are all consistent on the basic principle that a good partition should have a small intra-cluster variance and a large inter-cluster separation at the same time. Clustering algorithms are evaluated by numerous validity indices to reveal the quality of performance regarding produced clusters. Clustering and evaluation are the two steps that work coherently so that designs of algorithms are improved following their evaluation. Silhouette coefficient and DBI are the cluster validity indicators implemented in this paper. These cluster validation indicators were used to allocate energy consumers to clusters and to measure how certain the consumers belong to the category allocated to them.
Analysis
The implementation process using the methods described in the previous section to the London Smart meter dataset is described in this section. Utility companies in the generation, transmission, and distribution sectors will all benefit from the analysis and profound understanding of the load profiles of their customers in contemporary, very competitive, and deregulated electricity market. This strategic information is vital in load forecasting, demand-side management planning, and long-term resource and capital planning. This paper incorporates feature extraction into load profile modeling to address these problems and to also make the load data usable for clustering with the K-means algorithm.
Data pre-processing
Dataset is cleaned from any missing values by dropping rows that had null values (data cleaning). New attributes such as the month, weekday, weekend, day, minute, hour, and period are set and derived from the DateTime attribute. The period attribute is 1 for the morning period if the Hour attribute value is between 5 and 10 am, 2 for the afternoon period if the Hour attribute is between 11 am to 4 pm, 3 for the evening period if the Hour attribute is between 5 and 10 pm, 4 for night period if the Hour attribute is between 11 pm and 4 am. Outliers were detected and removed from the dataset using the Z-score method. As a result, a cleaned data frame containing 20,514,321 consumer measurements data frame is produced. The final attributes of the dataset and the description is shown in Tables 2 while Table 3 presents the cleaned dataset.
Feature extraction
Using the process of feature engineering, the following temporal features were extracted and implemented for clustering smart meter generated consumption data: Consumption_mean, Consumption_max, Consumption_min, avg cons Morning, avg cons Noon, avg cons Evening, avg cons Night, min cons in Days, max cons in Days. Using the backward elimination technique for model optimization, Consumption_mean and avg cons Evening features were selected. These two optimized features were used for clustering.
Clustering
The London electricity management system classifies its electricity consumers according to their tariffs. This clustering model does not consider any other features such as tariff plans etc. Clustering as an unsupervised data mining technique is implemented on London smart meter dataset to propose a new consumer segmentation. Electricity consumer segmentation is the subdivision of an electricity consumer base into groups called consumer segments such that each consumer segment consists of consumers who share similar electricity consumption characteristics. This segmentation is based on factors that can directly or indirectly influence electricity consumption such as the extracted temporal features which were constructed using the transformed 30 min consumption values. The K-means implementation employed in this paper is the SKlearn data analysis package for Python version 3.7. We used the SKlearn default settings for maximum iterations until convergence (max_iter) 300. The K-means was by default randomly initialized 10 times.
Deciding optimal number of clusters using Elbow method
The number of clusters must be decided in advance when we want to apply the K-means clustering. We use the elbow method to decide the optimal numbers of clusters [8, 18]. A scree plot is created which plots the number of clusters on the x-axis and the WCSS for each cluster number on the y-axis as shown in Fig. 3. The graph shows that as the number of clusters increase, the WCSS keeps decreasing. The decrease of WCSS is initially steep and then the rate of decrease slows down resulting in an elbow plot. The elbow formation in the graph indicates the number of clusters. The elbow may not be cleared, it may indicate that there may not be any natural groups in the data or may have more than one elbow in the graph, it may indicate that more than one natural group of clusters fit the data. The elbow method presents the variation of the number of clusters with the total WCSS. For that, K-means is computed with different values of k (number of clusters). Then, the total WCSS is calculated and WCSS versus the number of clusters curve is plotted. Then, the elbow is located in the plot. The minimization of the WCSS is the main objective. This point is considered to be the optimal number of clusters.

Elbow graph for clusters
From Fig. 3, it could be seen that the elbow curve was pronounced at number of clusters = 3. Hence, the analysis was done using three (3) as the optimal number of clusters. A scatter plot of the three (3) clusters is shown in Fig. 4.

Scatter plot of three selected clusters
Cluster evaluation using Silhouette analysis
The separation distances between clusters are analyzed using silhouette analysis [19, 20]. The range of the Silhouette score is [− 1, 1]. Near + 1 Silhouette score indicates that the sample is far away from its neighboring cluster, 0 Silhouette score indicates that the sample is on or very close to the decision boundary separating two neighboring clusters, − 1 Silhouette score indicates that the samples have been assigned to the wrong clusters. The measure of how close every point in a cluster is to the neighboring clusters is displayed by the silhouette plot in Fig. 5 with its scores in Fig. 6. The plot is be used to evaluate parameters like the number of clusters visually. For the temporal features clustering, the number of clusters 3 has a silhouette score of 0.387 which is the farthest value from 0 and closest to 1. Therefore, with n-clusters = 1 to 3, the samples will be far away from neighboring clusters (see Figs. 7, 8, 9).

Silhouette plot for all n-clusters

Silhouette scores for all n-clusters

Silhouette plot for n-clusters = 2

Silhouette plot for n-clusters = 3

Silhouette plot for n-clusters = 4
Cluster evaluation using Davies–Bouldin (DB) index
The aim of DB index is to identify sets of clusters that are compact with a small variance between members of the cluster and well separated, where the means of different clusters are sufficiently far apart, as compared to the within-cluster variance. The higher the Dunn index value, the better is the clustering. The number of clusters that maximizes the Dunn index is taken as the optimal number of clusters k. It also has some drawbacks. As the number of clusters and dimensionality of the data increase, the computational cost also increases. Feeding the Dunn index algorithm with different number of clusters within 2–11, the optimal number of clusters is obtained to be 3. DB plot for all n-clusters is shown in Fig. 10.

DB plot for all n-clusters
Model evaluation
Comparison of the traditional model and the smart meter-based model for clustering accuracy using the indices Mean Square Error (MSE), Root Mean Square Error (RMSE), Mean Absolute Error (MAE), and computation time are calculated as shown in Table 4.
The accuracy and computational efficiency of the proposed model is better than the traditional model by 83%, 67%, 84% and 54% for RMSE, MSE, MAE and computational speed, respectively, as shown in Table 4.
Estimation of yearly, monthly, weekly, and daily power consumption
-
Yearly analysis
Figure 11 shows yearly electricity consumption. The analysis shows that there was a yearly increase in consumption from 2011 to 2013, and a sharp decrease in peak from 2013 to 2014.
Fig. 11 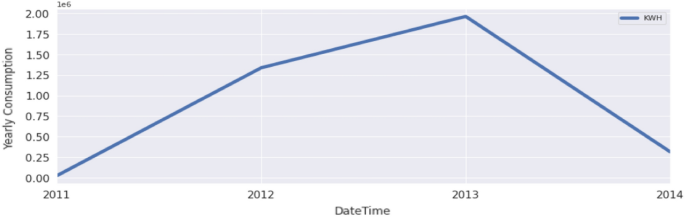
Diagram of average yearly consumption
-
Monthly analysis
Figure 12 indicates that August, July, and September have more electricity consumption than other months.
Fig. 12 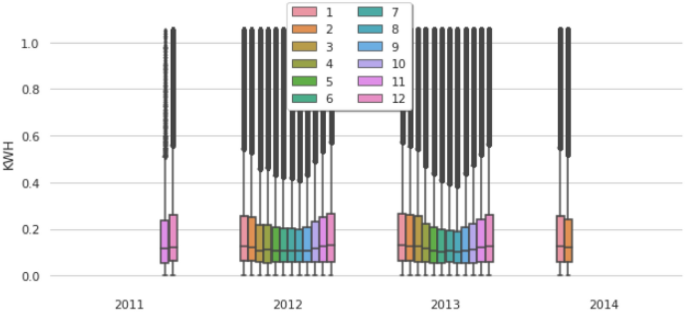
Diagram of average monthly consumption
-
Weekly analysis
The weekly power analysis is shown in Fig. 13a while Fig. 13b daily consumption.
Fig. 13 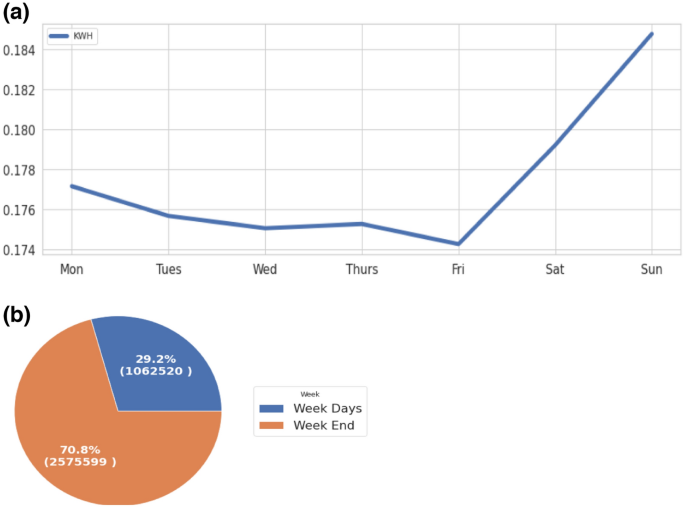
a Diagram of average weekly consumption. b Diagram of total daily consumption
-
Daily analysis
Management uses the daily analysis to understand consumers’ behavior with respect to daily power consumption. It shows that power is consumed more on Sundays with 14.8%, followed by Saturday with 16.4%. Daily power distribution is shown in Fig. 14.
Fig. 14 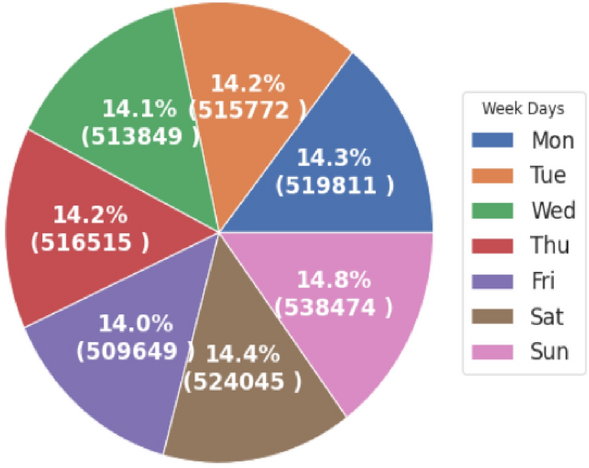
Diagram of total daily consumption
-
Periods and hourly analysis
“Evening” refers to 4 p.m. to 8 p.m.; “morning” refers to 4 a.m. to 12 pm.; “noon” refers to 12 p.m. to 4 p.m. and the “night” is otherwise. The period analysis shows that the highest total consumption was in the morning period at (30.9%) followed by the night period at (28.8%), followed by the evening period at (23%). Figure 15 shows period analysis over the measured time of the dataset. This analysis helps management understand consumer behavior in the use of electricity with respect to time.
Fig. 15 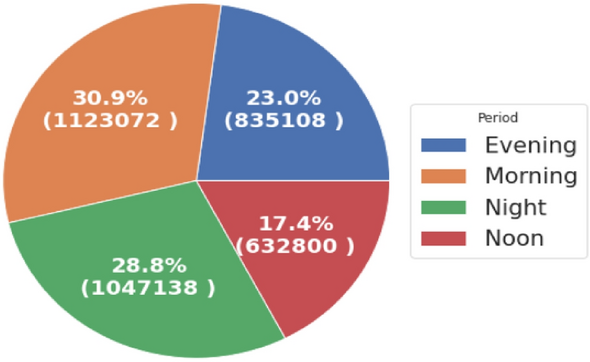
Diagram of total hourly consumption


Figure 16 shows the average consumption according to the consumption periods. From this plot, we can easily identify that on average, more power is consumed in the evening and night period.

Diagram of average hourly consumption
K-means algorithm computational complexity
Time complexity is:
(× K × I × d) for n = number of points, K = clusters, I = iterations, d = attributes, that is O(20,514,321*3*10*9) = O(5,538,866,670) = O(1).
The memory required is.
((n + K)) where n = number of points, K = clusters, d = attributes; that is.
O((20,514,321 + 3)*9) = O(184,628,916) = O(1).
Results and discussion
The average load consumption for all users is illustrated in 3 clusters, having the consumption values on the Y-axis and hours on X-axis. The load consumption for clusters 0, 1 and 2 is shown in Figs. 17, 18, and 19, respectively.
-
(i)
Cluster 0
-
(ii)
Cluster 1
-
(iii)
Cluster 2

Cluster 0 load diagram

Cluster 1 load diagram

Cluster 2 load diagram
The centroid for each cluster is what forms the representative load profile for each cluster as shown in Fig. 20.

Representative load diagram
Load Diagram of Clusters
From Fig. 20, it can be deduced that consumers in clusters 1 and 2 have a similar consumption lifestyle of low consumption in the morning hours and a slight increase in energy use toward the evening and night period. Cluster 0 is very different as it has the highest consumption in all periods, from morning to night.
Conclusion
The result of the cluster analysis helps power providing companies in their strategic, tactical, and operational planning and power management. The acquisition and maintenance costs of energy storage facilities, electricity cannot be stored for re-use, it is therefore of vital importance for power providing companies to better understand power consumers and helps them take better informed decision based on the power usage information available to them. The identified clusters are plausible and yield true information gain for the power providers in power demand management and in load sharing. Given direct integration with current IT systems (e.g., ERP or CRM), for metering service providers and utilities, this research is helpful in managing power distribution to different user categories in a region. The consumption style of a particular region will guide the power provider get prepared in managing the peak and low consumption periods. The result of this research can further be used by power providers to guide and advise power customers when best to deploy high, medium, and low-power consumption equipment for optimum power utilization and overall efficiency of the power grid.
Availability of data and materials
The data for this research are an open-source London Data Store energy consumption readings for a sample of 5567 London Households that took part in the UK Power Networks Led Low Carbon London project between November 2011 and February 2014 available at: https://data.london.gov.uk/dataset/smartmeter-energy-use-data-in-london-households. We merely analyzed the data and generated the result of this study which is included in this article.
Abbreviations
- SG:
-
Smart grid
- DERs:
-
Distributed energy resources
- PCA:
-
Principal component analysis
- DTW:
-
Dynamic time warping
- COP:
-
Cluster optimization
- API:
-
Application programming interface
- XML:
-
Extensible markup language
- SAX:
-
Simple API for XML
- SSE:
-
Sum of square error
- CVI:
-
Cluster validation index
- MIA:
-
Mean index adequacy
- CDI:
-
Clustering dispersion index
- DBI:
-
Davis–Bouldin index
- FCM:
-
Fuzzy C-means
- PBMF:
-
Fuzzy cluster validity index (Pakhira, M. K., Bandyopadhyay, S & Maulik U. (2004)
- CACI:
-
Consolidated analysis center incorporated
- CSV:
-
Comma separated values
- DToU:
-
Dynamic time of use
- ACORN:
-
A classification of residential neighborhoods
- ML:
-
Machine learning
- WCSS:
-
Within-cluster sum of squares
- DB:
-
Davis–Bouldin
- ERP:
-
Enterprise resource planning
- CRM:
-
Customer relationship management
- LCLid:
-
Low carbon London identity
- KWH:
-
Kilo watt hour
References
Martins JF, Pronto AG, Delgado-Gomes V, Sanduleac M (2019) Smart meters and metering infrastructure. In: Tascikaraoglu A, Erdinc O (eds) Pathways to a smarter power system. pp 89–114. https://doi.org/10.1016/B978-0-08-102592-5.00004-1
Gungor VC, Lu B, Hancke GP (2010) Opportunities and challenges of wireless sensor networks in smart grid. IEEE Trans Ind Electron 57(10):3557–3564
AbuBakar M (2019) Data mining applications in understanding electricity consumers’ behaviour: a case study of Tulkarm District, Palestine. Energies 12:4287. https://doi.org/10.3390/en12224287
Fazli WF, Do HK (2017) Short-term energy consumption prediction in korean residential buildings using optimized multi-layer perceptron. Kuwait J Sci 44(2):67–77. https://journalskuwait.org/kjs/index.php/KJS/article/view/1473
Ponta L, Raberto M, Teglio A, Cincotti S (2018) An agent-based stock-flow consistent model of the sustainable transition in the energy sector. Ecol Econ 145:274–300
Rajesh K, Chakraborty B (2022) A novel cluster-specific analysis framework for demand-side management and net metering using smart meter data. Sustain Energy Grids Netw 31:100771. https://doi.org/10.1016/j.segan.2022.100771
Jiang Z, Lin R, Yang F (2018) A hybrid machine learning model for electricity consumer categorization using smart meter data. Energies. https://doi.org/10.3390/en11092235
Umargono E, Suseno J, Gunawan SK (2020) K-means clustering optimization using the Elbow method and early centroid determination based on mean and median formula. In: Proceedings of the international conferences on information system and technology (CONRIST 2019), pp 234–240. ISBN: 978-989-758-453-4. https://doi.org/10.5220/000990840234024. https://www.scitepress.org/Papers/2019/99084/99084.pdf
Idrees AM, Shaaban EM (2020) Reforming home energy consumption behavior based on mining techniques, a collaborative home appliances approach. Kuwait J Sci 47(4)
Oyedokun J, Bu S, Xiao Y, Han Z (2018) Smart meter data characterization and clustering for peak demand targeting in smart grids. In: IEEE PES innovative smart grid technologies conference Europe (ISGT-Europe), pp 1–6. https://doi.org/10.1109/ISGTEurope.2018.8571875
Funde AN, Dhabu MM, Paramasivam A, Deshpande PS (2018) Motif-based association rule mining and clustering technique for determining energy usage patterns for smart meter data. Sustain Cities Soc 46:101–415. https://doi.org/10.1016/j.scs.2018.12.043
Alexander T, Per SN, Henrik M (2018) Electricity consumption clustering using smart meter data. Energies 859:1–18. https://doi.org/10.3390/en11040859
Mahi H, Farhi N, Labed K (2015) Remotely sensed data clustering using K-harmonic means algorithm and cluster validity index. In: Amine A, Bellatreche L, Elberrichi Z, Neuhold E, Wrembel R (eds) Computer science and its applications. CIIA 2015, IFIP Advances in Information and Communication Technology, vol 456. Springer, Cham. https://doi.org/10.1007/978-3-319-19578-0_9
Olatz A, Ibai G, Javier M, Jesus MP, Inigo P (2012) An extensive comparative study of cluster validity indices. Pattern Recogn 46(2013):243–256
Czétány L, Vámos V, Horváth M, Szalay Z, Mota-Babiloni A, Deme-Bélafi Z, Csoknyai T (2021) Development of electricity consumption profiles of residential buildings based on smart meter data clustering. Energy Build 252:111376. https://doi.org/10.1016/j.enbuild.2021.111376
Zhou K, Yang C, Shen J (2017) Discovering residential electricity consumption patterns through smart-meter data mining: a case study from China. Utilities Policy. https://doi.org/10.1016/j.jup.2017.01.004
Nitin K, Nancy J (2015) Practical analytics, 2nd Edn. Applied Analytics Concepts Using Market Leading Software Tools. Epistemy Press. https://epistemypress.com
Syakur MA et al (2018) Integration K-Means clustering method and elbow method for identification of the best customer profile cluster. IOP Conf Ser Mater Sci Eng 336:012017. https://doi.org/10.1088/1757-899X/336/1/012017
Wang F, Franco-Penya HH, Kelleher JD, Pugh J, Ross R (2017) An analysis of the application of simplified silhouette to the evaluation of k-means clustering validity. https://doi.org/10.1007/978-3-319-62416-7_21
Saputrai DM, Saputrai D, Oswari LD (2019) Effect of distance metrics in determining K-value in K-means clustering using Elbow and Silhouette method. Adv Intell Syst Res 172:341–346
Acknowledgements
Not applicable.
Funding
The authors declare that they did not receive any funding for this research.
Author information
Authors and Affiliations
Contributions
We declare that GEO, MCB, and CNO contributed to the design and implementation of the research. GEO, CNO, ECU, SCE, and CIU contributed to the analysis of the results and the writing of the manuscript. The manuscript has been read and approved by all named authors, and no other person(s) who satisfied the criteria for authorship is/are not listed. The final manuscript was read and approved by all authors before submission.
Corresponding author
Ethics declarations
Competing interests
The authors of this study declare that they have no competing interests.
Additional information
Publisher's Note
Springer Nature remains neutral with regard to jurisdictional claims in published maps and institutional affiliations.
Rights and permissions
Open Access This article is licensed under a Creative Commons Attribution 4.0 International License, which permits use, sharing, adaptation, distribution and reproduction in any medium or format, as long as you give appropriate credit to the original author(s) and the source, provide a link to the Creative Commons licence, and indicate if changes were made. The images or other third party material in this article are included in the article's Creative Commons licence, unless indicated otherwise in a credit line to the material. If material is not included in the article's Creative Commons licence and your intended use is not permitted by statutory regulation or exceeds the permitted use, you will need to obtain permission directly from the copyright holder. To view a copy of this licence, visit http://creativecommons.org/licenses/by/4.0/.
About this article

Cite this article
Okereke, G.E., Bali, M.C., Okwueze, C.N. et al. K-means clustering of electricity consumers using time-domain features from smart meter data. Journal of Electrical Systems and Inf Technol 10, 2 (2023). https://doi.org/10.1186/s43067-023-00068-3
Received:
Accepted:
Published:
DOI: https://doi.org/10.1186/s43067-023-00068-3